Monitor Everything You Run
From web servers and databases to containers and VPNs — Xitoring's agent auto-discovers your stack and starts collecting metrics in minutes.
Easily Setup Integrations Within a Minute
Xitoring delivers fast, reliable server monitoring integrations for Windows and Linux, so you can connect and optimize without extra software or manual configuration.
No Extra Software
Everything runs through the lightweight Xitogent agent already installed on your server. No additional dependencies.
No Manual Configuration
Integrations are auto-discovered and pre-configured. Just enable them and start receiving metrics instantly.
Windows & Linux
Full support for both platforms with identical feature parity. One agent, every operating system, all your services.
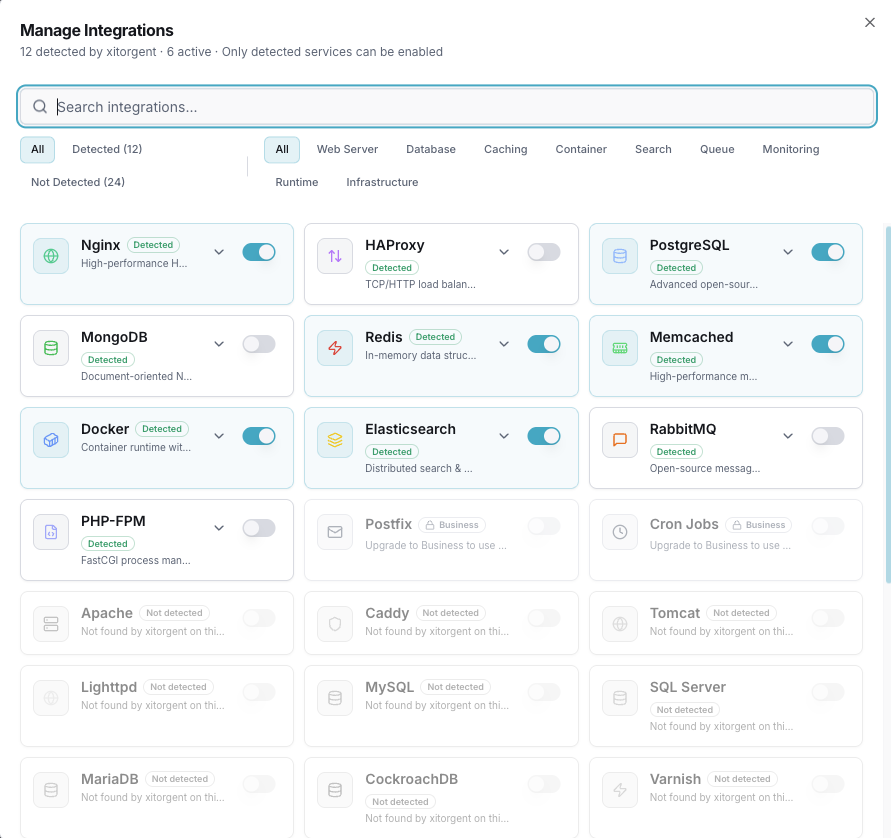
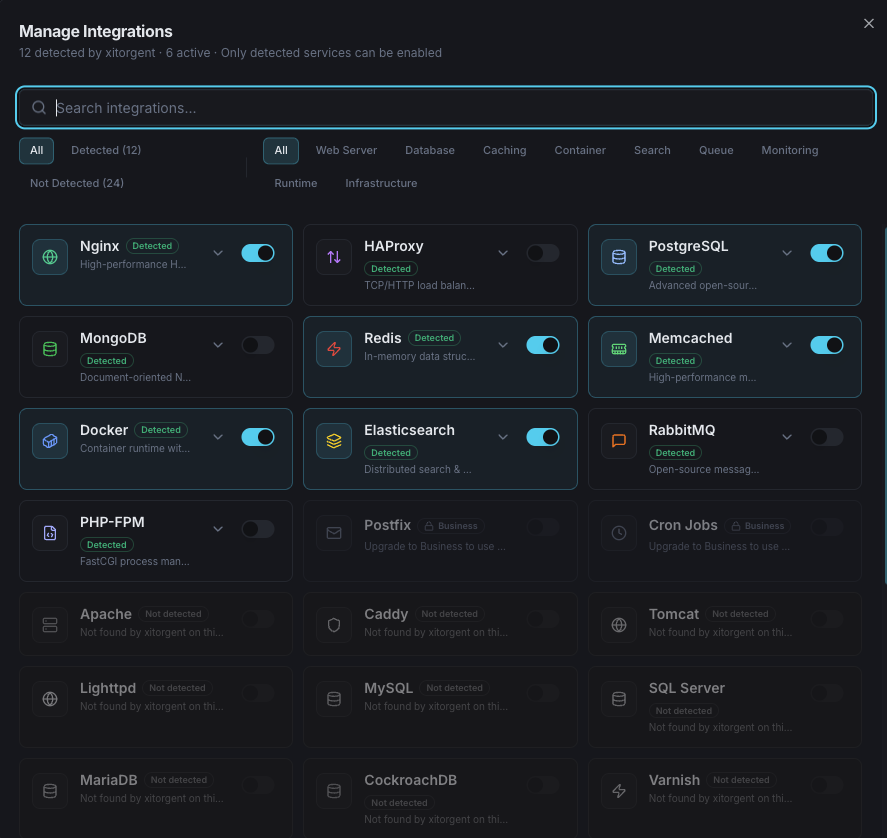
Seamless Integration Control via UI
Enable, configure, and manage all your integrations directly from the Xitoring dashboard. No terminal needed — just a few clicks to start monitoring any service on your server. Toggle integrations on and off, set custom thresholds, and view real-time status all from a single, intuitive interface.
Powerful Integration Control via CLI
Prefer the command line? Use Xitogent CLI to enable integrations, adjust thresholds, and automate setup across your entire fleet with simple, scriptable commands. Perfect for DevOps teams who manage infrastructure as code and need repeatable, automated workflows.
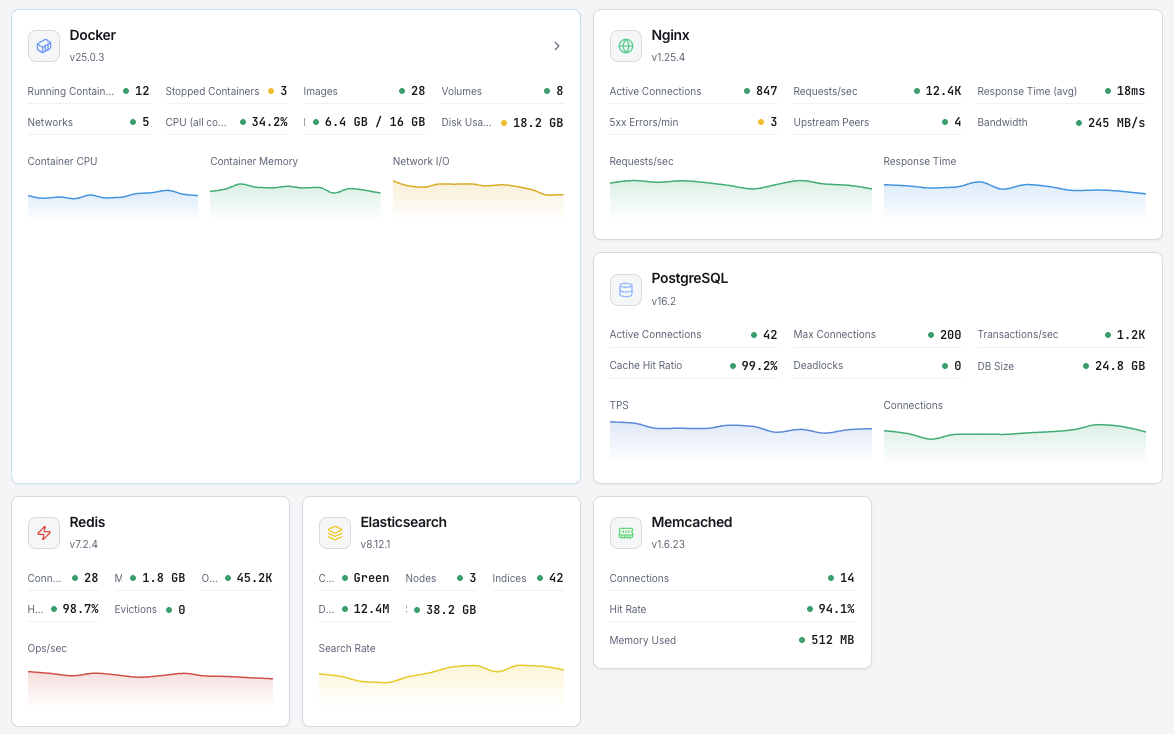
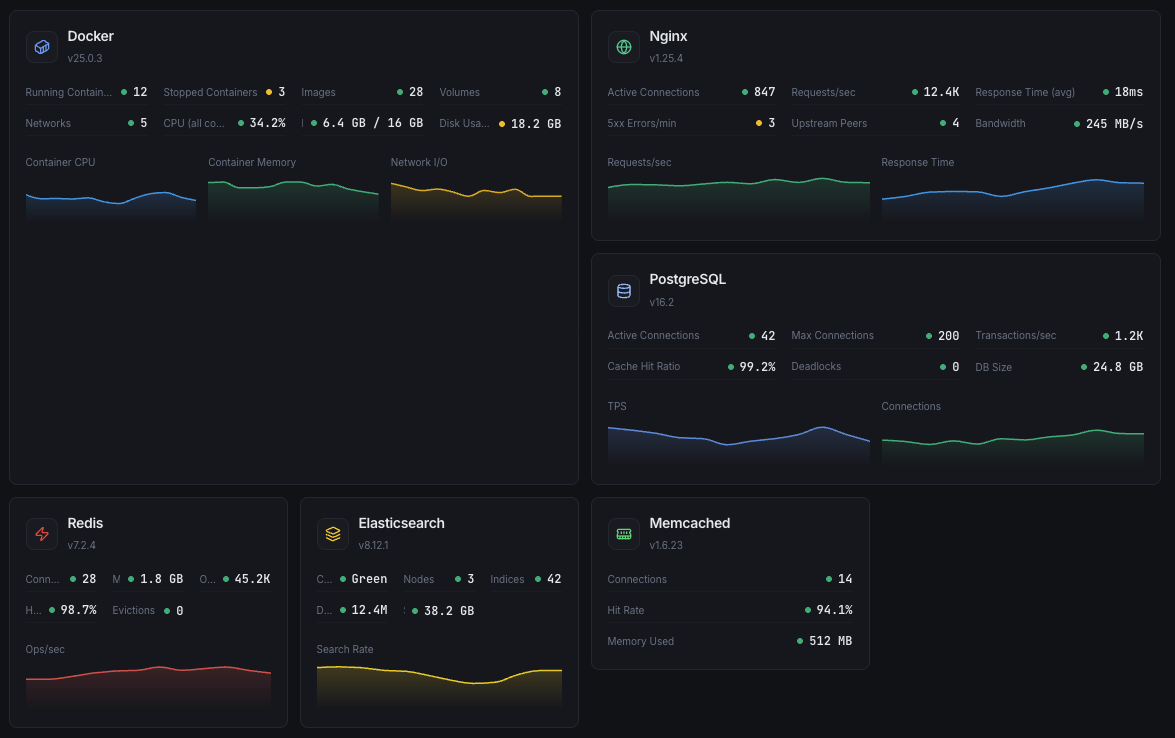
Complete Metrics Monitoring at Your Fingertips
Every integration delivers real-time metrics, historical trends, and customizable alerts. From CPU usage and database queries to queue depths and VPN tunnel status — everything is visualized in one unified, powerful dashboard that keeps your team informed.
Showing 30 integrations
Web & Application Servers
Monitor your web infrastructure with deep metrics for request rates, response times, and connection states.
Track mail queue sizes, delivery rates, and connection metrics for your mail infrastructure.
Databases
Monitor query performance, replication lag, connections, and storage across your database layer.
Data Systems
Track caching, message queues, search engines, and time-series data infrastructure.
DNS Server
Observe DNS query rates, cache hit ratios, and resolution latency.
Network & Proxy Services
Gain visibility into proxy backends, connection states, and network socket statistics.
Containers & System Health
Track container resource usage, disk SMART data, and system-level health indicators.
VPN
Monitor tunnel status, connected clients, and throughput for your VPN infrastructure.
Don't See Your Stack?
We're constantly adding new integrations. Let us know what you need and we'll prioritize it.