Apache Monitoring
Monitor Apache HTTP Server performance, request rates, and connection states in real time with zero configuration.
Why monitor Apache?
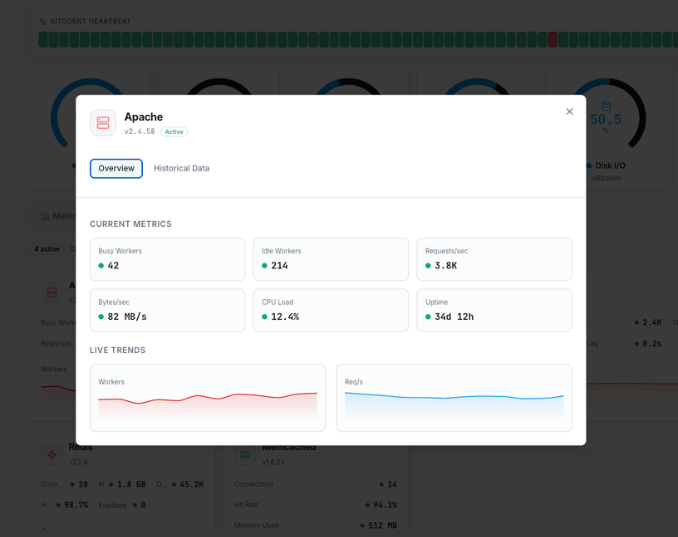
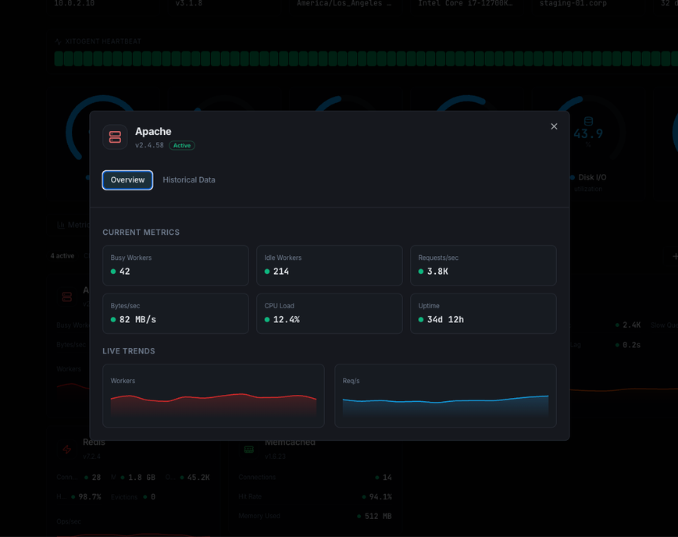
Apache HTTP Server is the world's most widely used web server, powering millions of websites. Monitoring Apache is essential to ensure optimal performance, detect bottlenecks before they impact users, and maintain high availability. Xitoring's Apache integration provides deep visibility into your server's health with real-time metrics collection via mod_status.
What we monitor
Total Requests
Total number of HTTP requests processed since the server started.
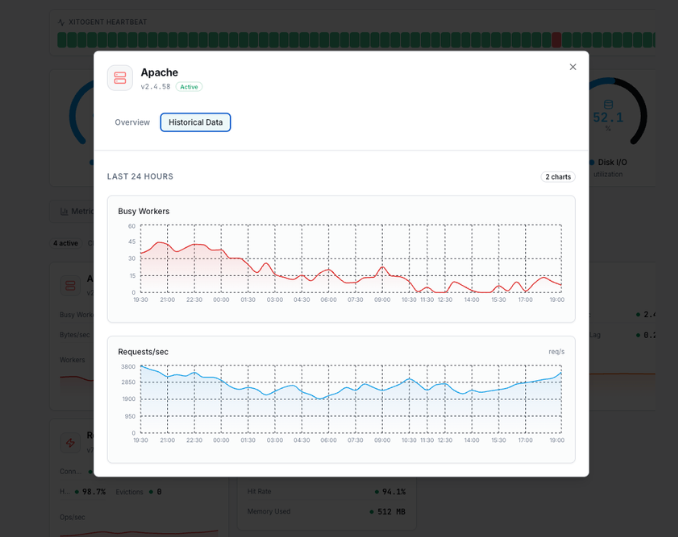
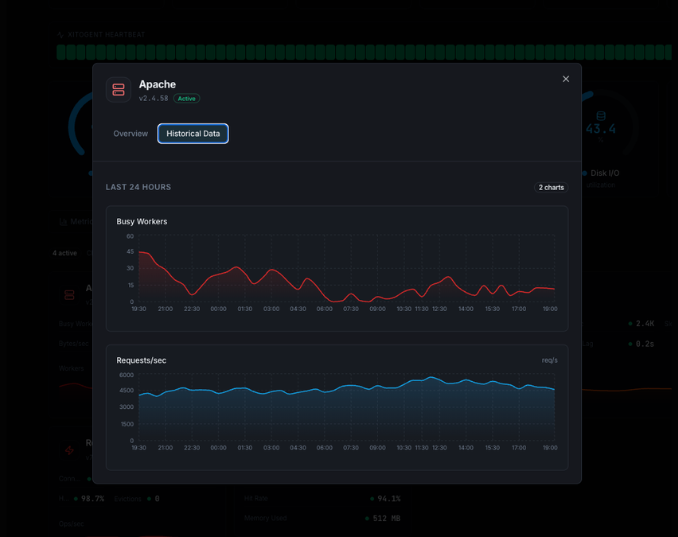
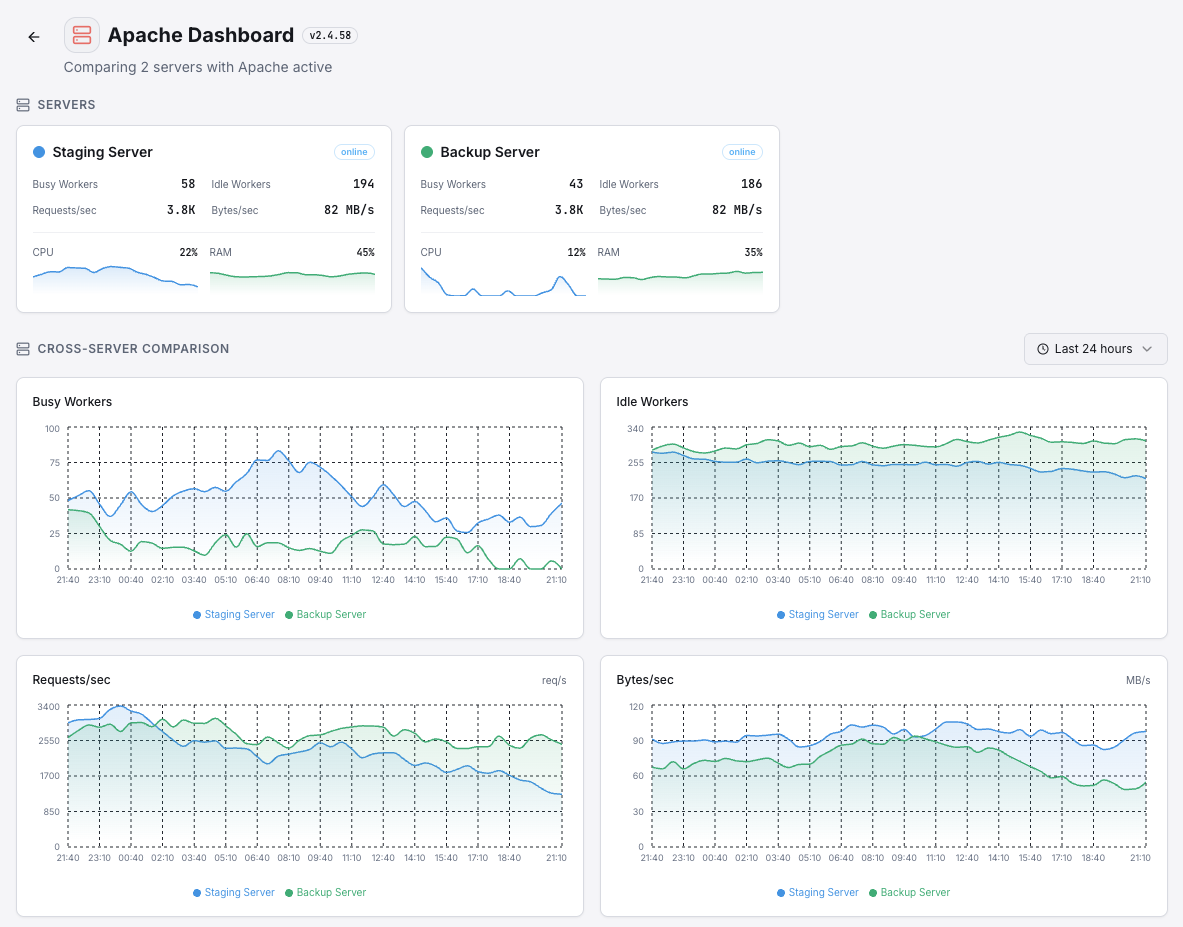
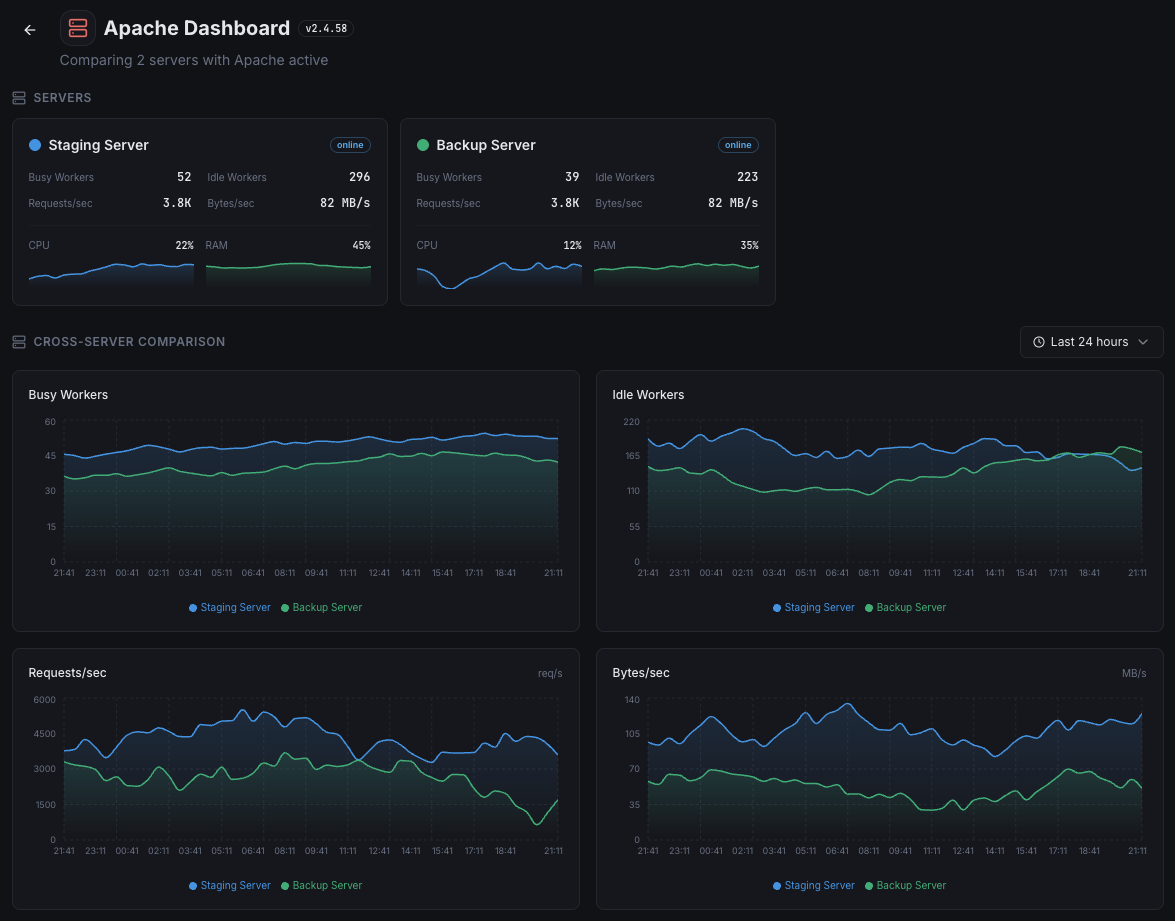
Requests per Second
Current rate of incoming HTTP requests hitting your server.
Bytes per Second
Data throughput rate measuring how much data Apache is serving.
Bytes per Request
Average response size per request, useful for detecting payload anomalies.
Busy Workers
Number of worker threads actively processing requests.
Idle Workers
Number of worker threads waiting for incoming requests.
Connections Total
Total number of connections accepted by the server.
Connections Async Writing
Connections in async write state, waiting to send data to clients.
Connections Async Keep-Alive
Connections held open in keep-alive state for potential reuse.
Connections Async Closing
Connections in the process of being gracefully closed.
Server Uptime
Total time the Apache server has been running without restart.
CPU Load
Percentage of CPU consumed by Apache worker processes.
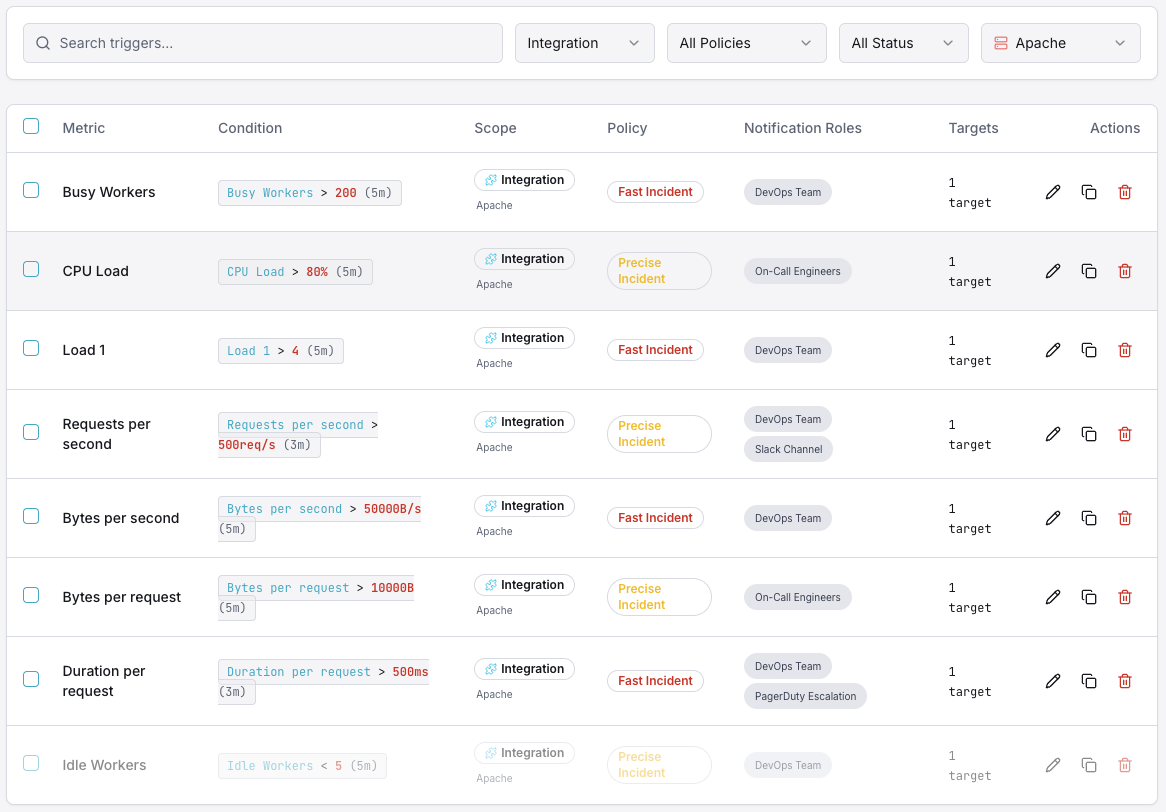
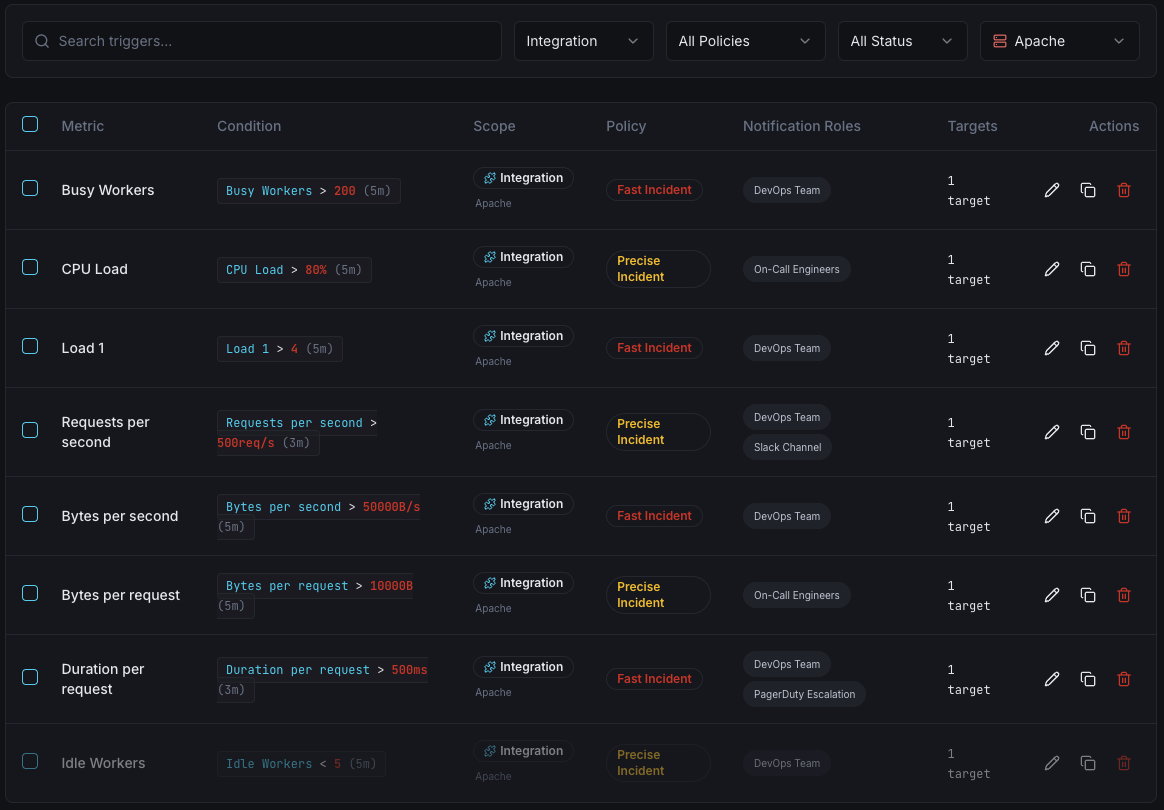
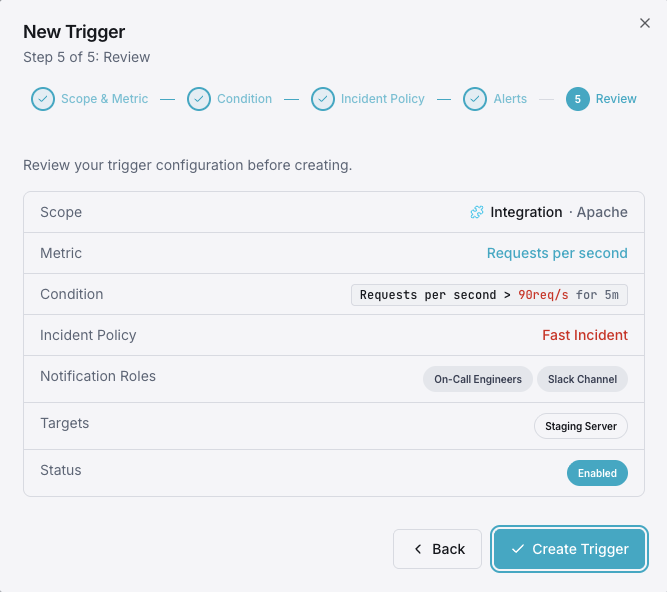
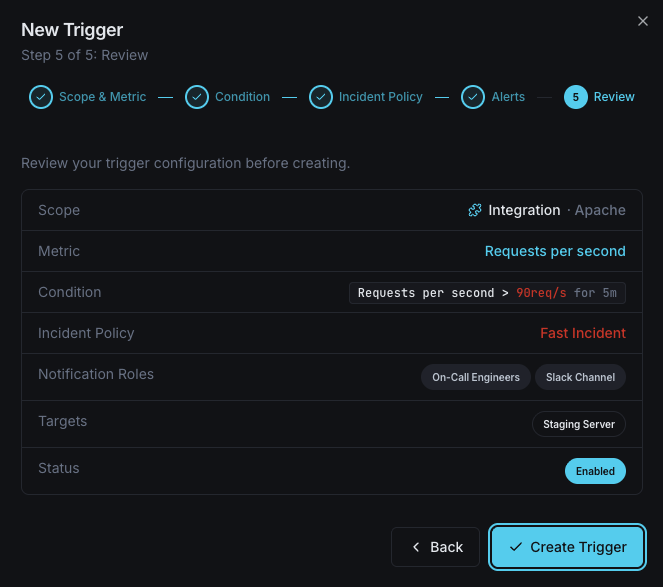
Configurable alert triggers
Set up custom triggers in your dashboard to get notified the moment Apache metrics cross your defined thresholds.
Busy Workers
warningFires when the number of active worker threads exceeds your threshold, indicating the server is under heavy load and may start queuing requests.
Idle Workers
criticalTriggers when idle workers drop below a minimum, meaning the server has little spare capacity to handle incoming traffic spikes.
Requests per Second
warningAlerts when the request rate exceeds normal baselines, useful for detecting traffic surges, DDoS patterns, or runaway bots.
CPU Load
criticalFires when Apache's CPU consumption crosses your defined limit, signaling resource contention that could degrade response times.
Bytes per Second
warningTriggers on abnormal throughput — either unusually high (possible data exfiltration) or low (upstream issues).
Server Uptime Reset
criticalDetects when the server uptime counter resets to zero, indicating an unexpected Apache restart or crash event.
Importance of Apache Monitoring
Apache powers over 30% of all active websites globally. Without proper monitoring, performance degradation, traffic spikes, and resource exhaustion can go undetected — leading to downtime, lost revenue, and poor user experience.
- Detect slow response times before they impact end users
- Identify memory leaks and resource exhaustion early
- Prevent cascading failures across your infrastructure
- Maintain SLA compliance with real-time visibility
- Correlate Apache metrics with upstream application performance
Why Choose Xitoring
Xitoring delivers enterprise-grade Apache monitoring with zero-config setup. Our lightweight agent auto-discovers your Apache instances, starts collecting metrics in under 60 seconds, and integrates with your existing notification channels.
- One-command install — no complex YAML or config files
- 50+ global monitoring nodes for low-latency checks
- Unified dashboard for servers, services, and uptime
- Flexible alerting via Slack, PagerDuty, Telegram & more
- Historical data retention for capacity planning & audits
Get started in minutes
Install Xitogent on your server
If you haven't already, install the lightweight Xitogent monitoring agent on your server.
curl -s https://xitoring.com/install.sh | sudo bashEnable mod_status in Apache
Ensure mod_status is enabled and accessible locally. Add the following to your Apache configuration:
<Location "/server-status">
    SetHandler server-status
    Require local
</Location>Enable the Apache integration
Use the Xitoring dashboard or CLI to enable the Apache integration. Xitogent will auto-detect your Apache instance.
sudo xitogent integrate apache --enableConfigure alert thresholds (optional)
Set custom thresholds for metrics like busy workers, request rate, or CPU load to get notified when something needs attention.
Frequently asked questions
Start monitoring Apache today
Set up in under 60 seconds. No credit card required. Full metrics from day one.
Start Free Trial