Elasticsearch Monitoring
Monitor Elasticsearch cluster health, indexing rates, JVM heap usage, and search latency in real time with zero configuration.
Why monitor Elasticsearch?
Elasticsearch powers search, logging, and analytics for thousands of organizations worldwide. Monitoring Elasticsearch is critical to maintain cluster health, optimize indexing throughput, track search latency, and prevent JVM heap exhaustion. Xitoring's Elasticsearch integration provides deep visibility into every aspect of your cluster.
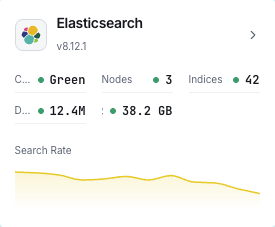
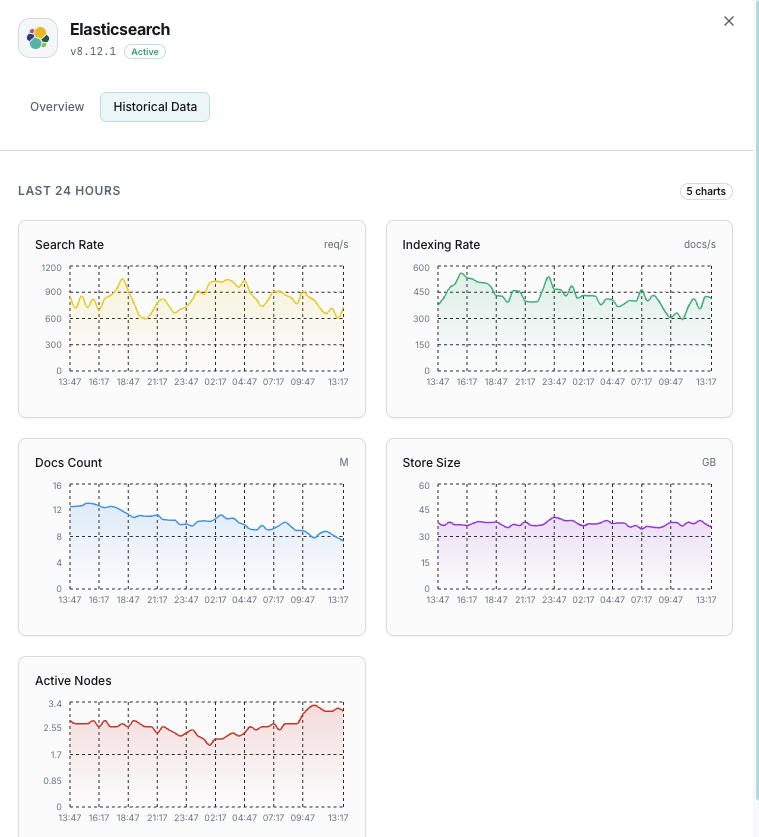
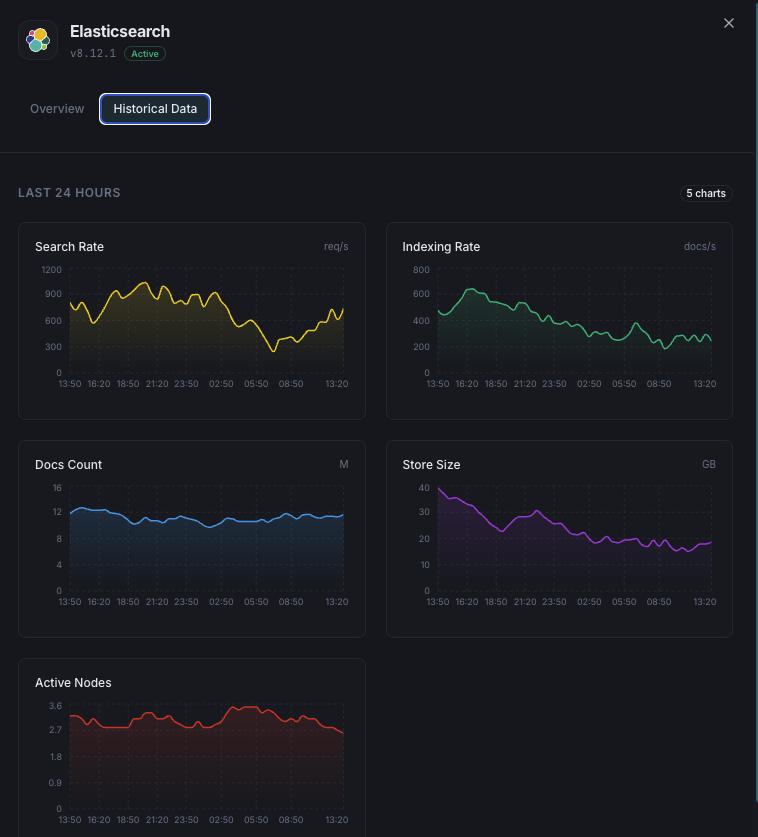
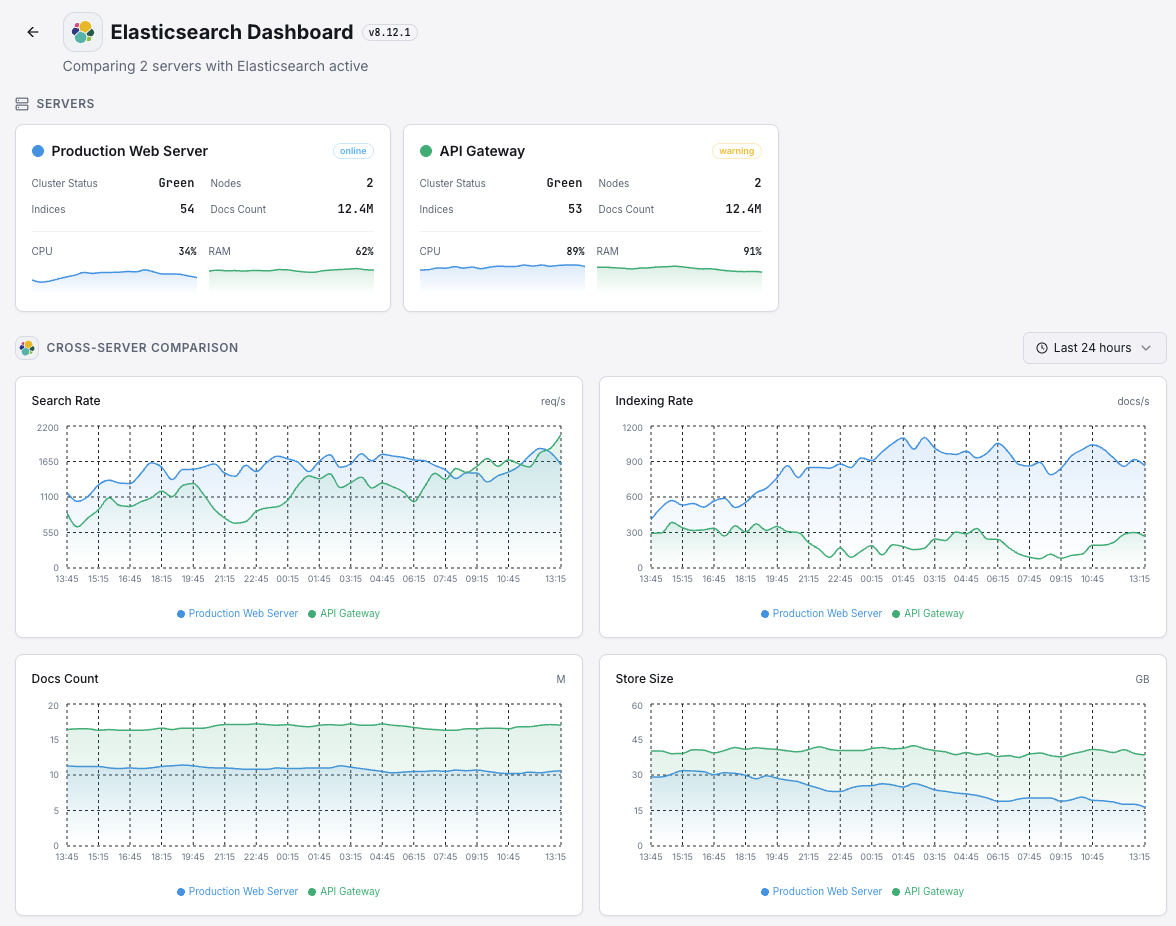
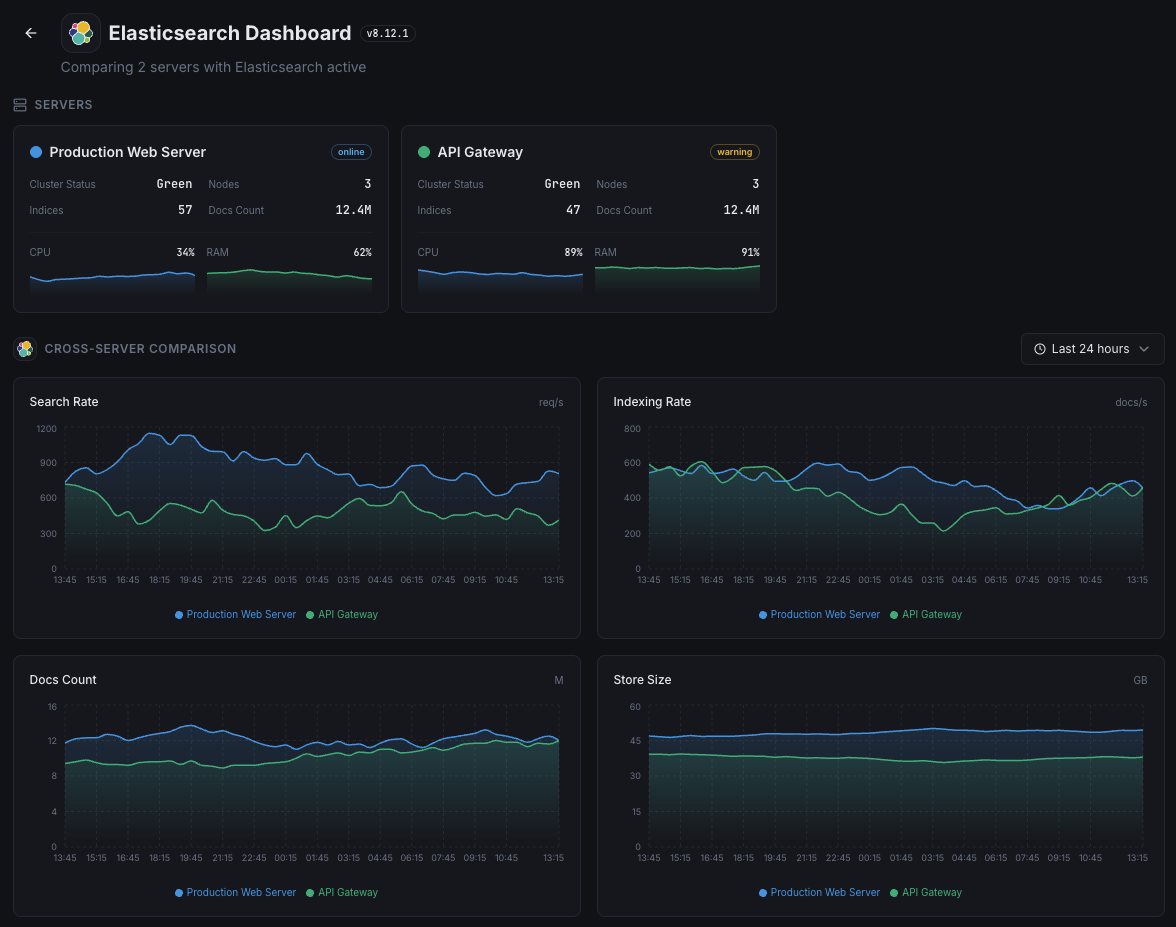
What we monitor
Cluster Health
Overall cluster status (green/yellow/red) and active shard count.
JVM Heap Usage
Heap used, committed, and max across all nodes with GC stats.
Indexing Rate
Documents indexed per second across the cluster.
Search Rate
Search queries per second and average search latency.
Shard Count
Active, relocating, initializing, and unassigned shards.
Pending Tasks
Cluster-level pending tasks that can indicate bottlenecks.
CPU Usage
Per-node CPU utilization and OS-level load averages.
Disk Usage
Storage used per node and available disk space.
Thread Pool
Active, queued, and rejected tasks in each thread pool.
Circuit Breakers
Memory estimates and trip counts for request/fielddata/in-flight breakers.
Segment Count
Number of Lucene segments and merge activity.
Fielddata Cache
Fielddata cache size and eviction count.
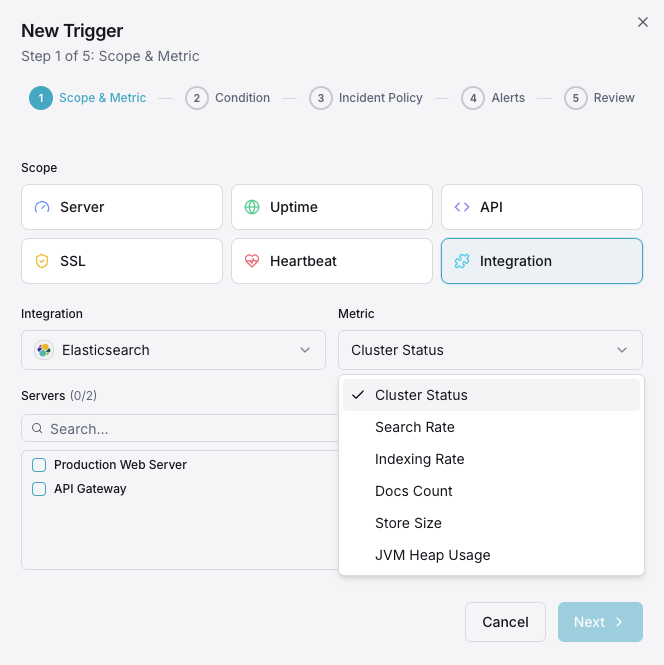
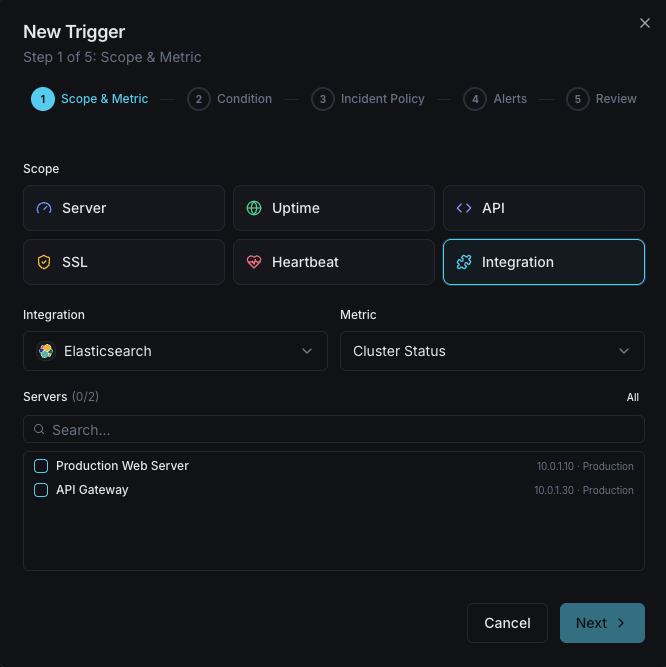
Configurable alert triggers
Set up custom triggers in your dashboard to get notified the moment Elasticsearch metrics cross your defined thresholds.
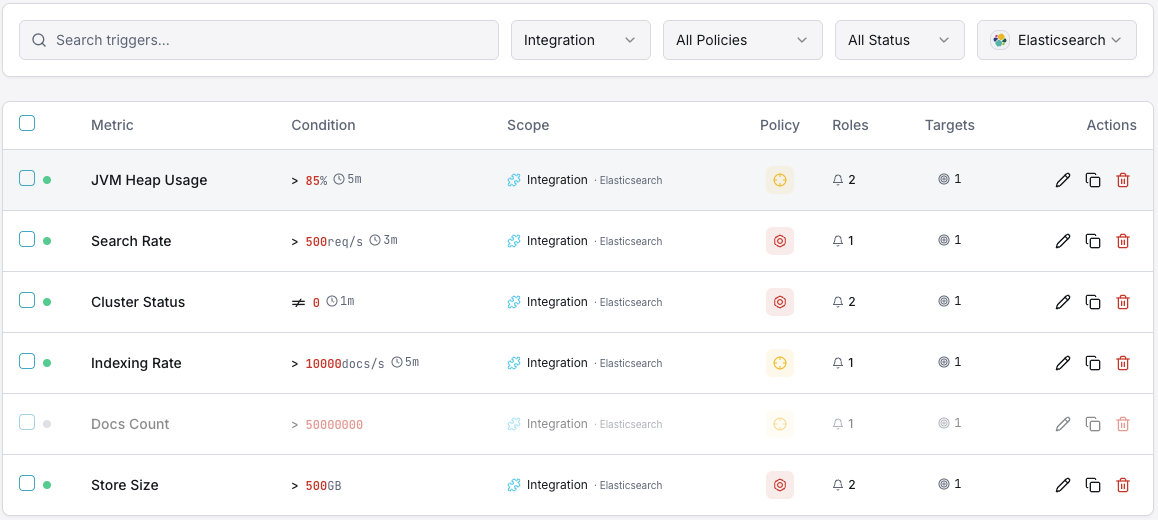
Cluster Health
criticalFires when cluster status degrades to yellow or red, indicating shard allocation issues.
JVM Heap Usage
criticalTriggers when JVM heap usage exceeds threshold, risking out-of-memory errors and node instability.
Indexing Rate
warningAlerts when indexing throughput drops below baseline, indicating ingestion pipeline issues.
Search Latency
warningFires when average search latency exceeds threshold, degrading user-facing search quality.
Unassigned Shards
criticalTriggers when shards remain unassigned, leaving data under-replicated and at risk.
Thread Pool Rejections
warningAlerts when thread pool queues overflow and start rejecting requests.
Importance of Elasticsearch Monitoring
Elasticsearch underpins search functionality, log aggregation, and real-time analytics. Without monitoring, cluster degradation, JVM pressure, and unassigned shards can cascade into search outages and data loss.
- Detect cluster health degradation before it impacts search availability
- Monitor JVM heap to prevent out-of-memory crashes
- Track indexing throughput to ensure data ingestion pipelines stay healthy
- Identify unassigned shards that leave data under-replicated
- Optimize search latency for user-facing applications
Why Choose Xitoring
Xitoring delivers enterprise-grade Elasticsearch monitoring with zero-config setup. Our lightweight agent auto-discovers your Elasticsearch nodes, starts collecting metrics in under 60 seconds, and integrates with your existing notification channels.
- One-command install — no complex YAML or config files
- 50+ global monitoring nodes for low-latency checks
- Unified dashboard for servers, search clusters, and uptime
- Flexible alerting via Slack, PagerDuty, Telegram & more
- Historical data retention for capacity planning & audits
Get started in minutes
Install Xitogent on your server
If you haven't already, install the lightweight Xitogent monitoring agent on your server.
curl -s https://xitoring.com/install.sh | sudo bashVerify Elasticsearch API is accessible
Xitogent uses the Elasticsearch REST API to collect metrics. Verify the cluster is reachable:
curl -s http://localhost:9200/_cluster/health | python3 -m json.toolEnable the Elasticsearch integration
Use the Xitoring dashboard or CLI to enable the Elasticsearch integration.
sudo xitogent integrate elasticsearch --enableConfigure alert thresholds (optional)
Set custom thresholds for cluster health, JVM heap, or indexing rate to get notified when something needs attention.
Frequently asked questions
Start monitoring Elasticsearch today
Set up in under 60 seconds. No credit card required. Full metrics from day one.
Start Free TrialKeep exploring