MSSQL Monitoring
Monitor Microsoft SQL Server query performance, wait statistics, buffer cache, and transaction log health in real time with zero configuration.
Why monitor MSSQL?
Microsoft SQL Server powers enterprise applications, data warehouses, and business intelligence platforms worldwide. Monitoring MSSQL is essential to optimize query execution plans, track wait statistics, manage buffer cache efficiency, and detect deadlocks. Xitoring's MSSQL integration provides comprehensive visibility into your SQL Server instances.
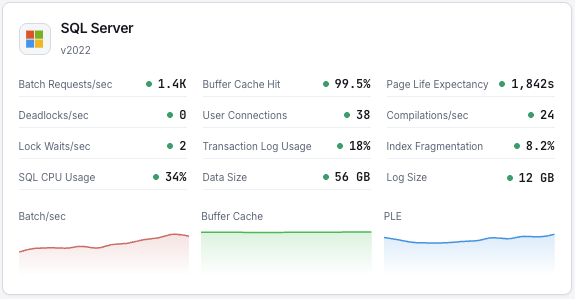
What we monitor
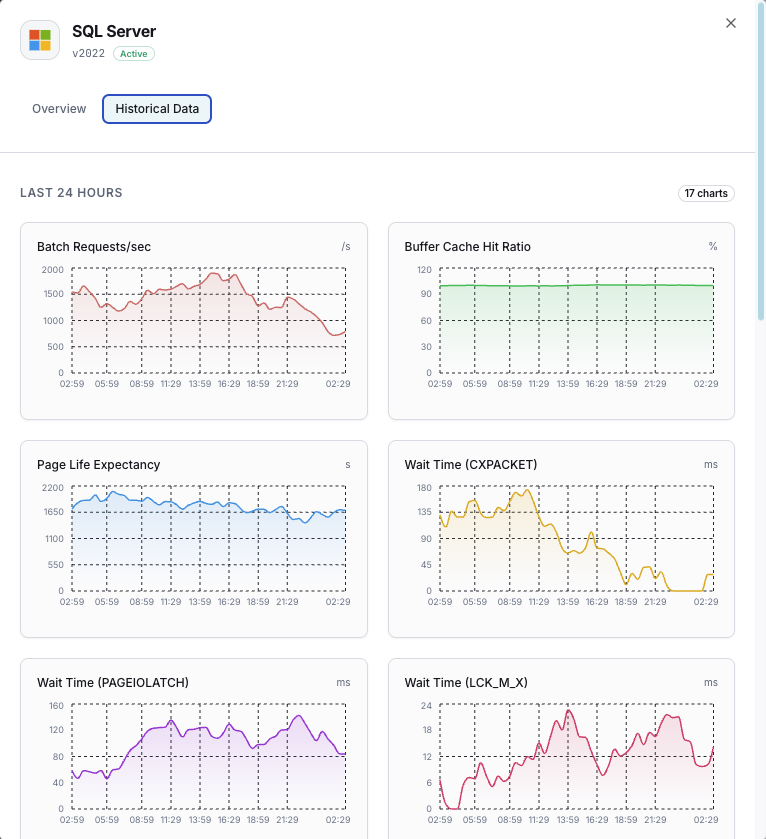
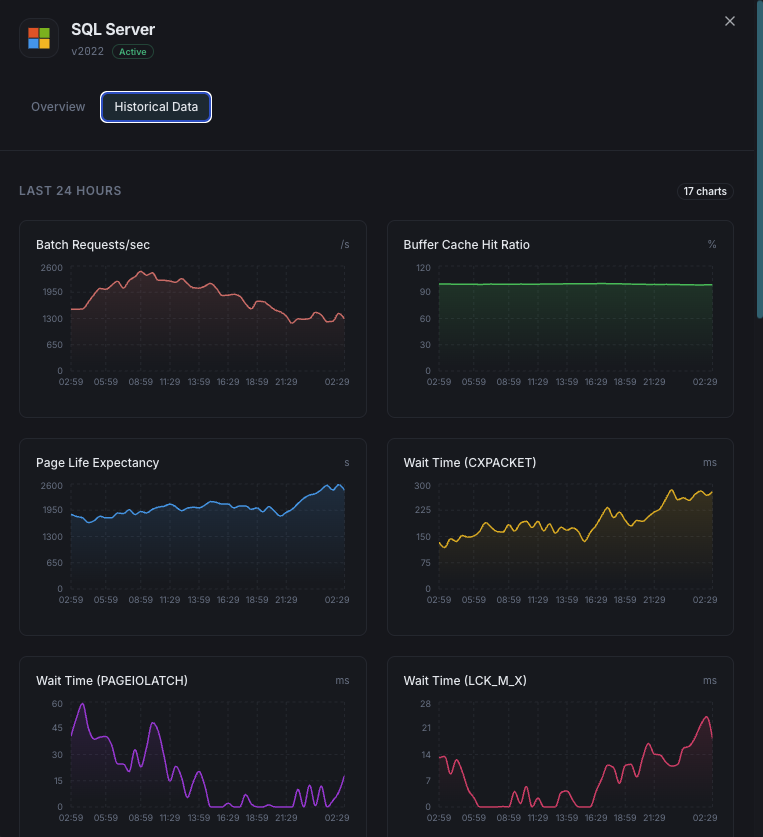
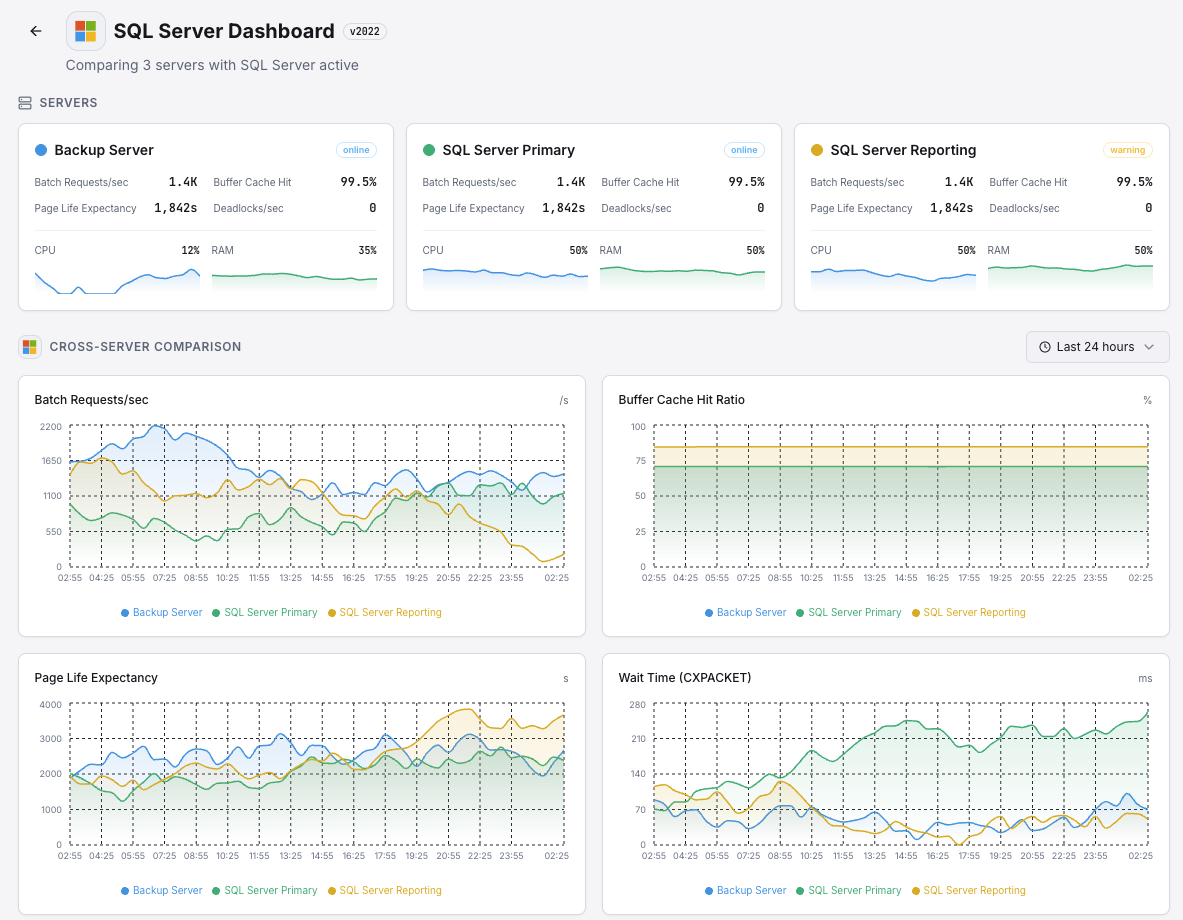
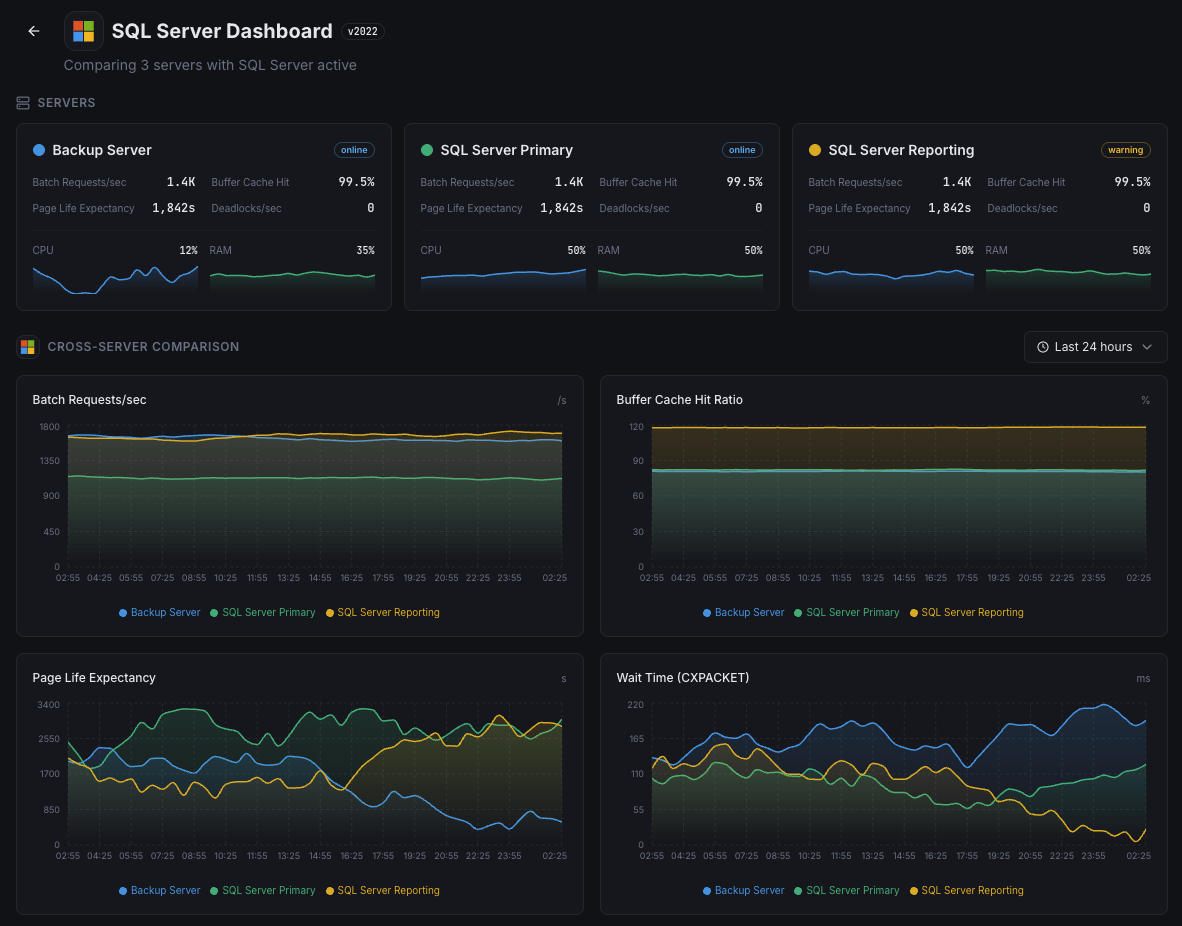
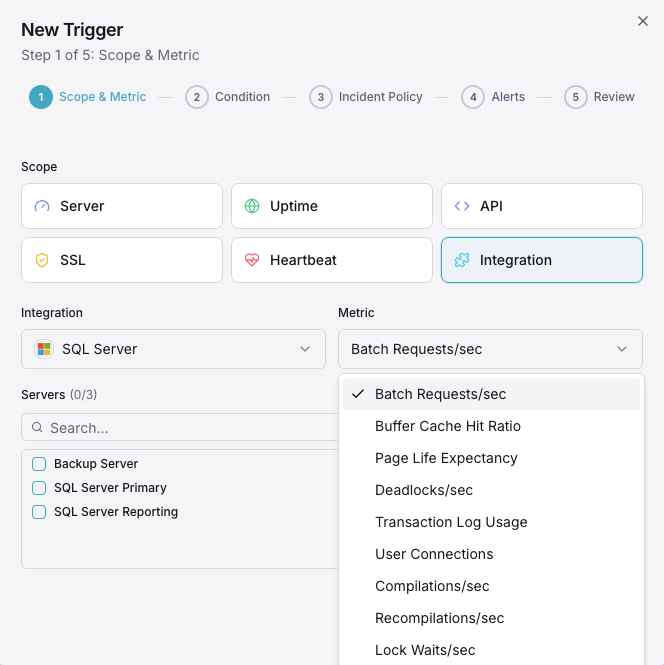
Batch Requests/sec
Number of SQL batch requests received per second.
Buffer Cache Hit Ratio
Percentage of page reads satisfied from buffer pool vs physical disk reads.
Page Life Expectancy
Average time (seconds) a page stays in the buffer pool — lower values indicate memory pressure.
Wait Statistics
Top wait types and durations indicating resource bottlenecks.
Deadlocks/sec
Number of lock requests that resulted in deadlocks.
Transaction Log Usage
Percentage of transaction log space used per database.
User Connections
Number of active user connections to the SQL Server instance.
Compilations/sec
Number of SQL compilations and recompilations per second.
Lock Waits/sec
Number of lock requests that required the caller to wait.
Index Fragmentation
Fragmentation level of indexes across databases.
CPU Usage
SQL Server process CPU utilization vs total system CPU.
Database Size
Data and log file sizes for each database.
Configurable alert triggers
Set up custom triggers in your dashboard to get notified the moment MSSQL metrics cross your defined thresholds.
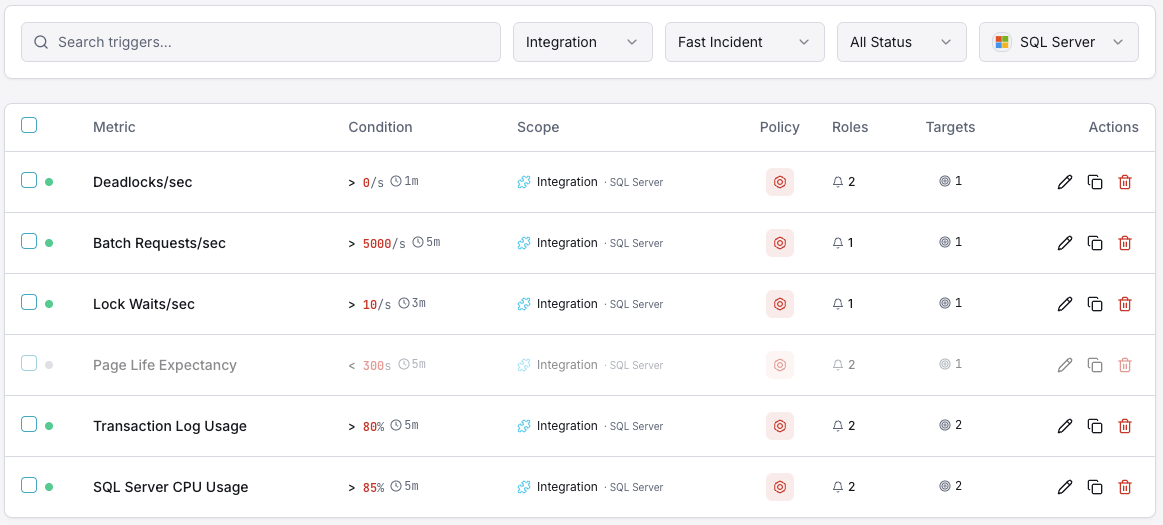
Buffer Cache Hit Ratio
criticalFires when cache hit ratio drops below threshold, indicating insufficient memory for workload.
Page Life Expectancy
warningTriggers when PLE drops below threshold, meaning pages are being flushed too quickly from memory.
Deadlocks
criticalAlerts when deadlock rate exceeds threshold, indicating lock contention in application queries.
Transaction Log Usage
criticalFires when transaction log usage exceeds threshold, risking write failures.
User Connections
warningTriggers when connection count approaches limits, risking connection refused errors.
Wait Statistics
warningAlerts when specific wait types spike, indicating resource bottlenecks (CPU, I/O, memory, locks).
Importance of MSSQL Monitoring
SQL Server runs mission-critical enterprise workloads — from ERP systems and financial databases to e-commerce platforms. Without monitoring, buffer pressure, deadlocks, and transaction log bloat can cause outages and data corruption.
- Detect memory pressure through buffer cache and PLE metrics
- Monitor wait statistics to identify the root cause of slowdowns
- Track deadlocks to fix application-level locking issues
- Ensure transaction log space for uninterrupted write operations
- Optimize index usage to maintain query performance over time
Why Choose Xitoring
Xitoring delivers enterprise-grade SQL Server monitoring with zero-config setup. Our lightweight agent auto-discovers your MSSQL instances, starts collecting metrics in under 60 seconds, and integrates with your existing notification channels.
- Native Windows Server support with easy installer
- 50+ global monitoring nodes for low-latency checks
- Unified dashboard for servers, databases, and uptime
- Flexible alerting via Slack, PagerDuty, Telegram & more
- Historical data retention for capacity planning & audits
Get started in minutes
Install Xitogent on your Windows server
Download and install the Xitogent agent on your Windows Server hosting SQL Server.
# Download from https://xitoring.com/xitogent
# Run the installer as AdministratorConfigure SQL Server access
Create a dedicated login for monitoring with minimal privileges:
CREATE LOGIN [xitoring] WITH PASSWORD = 'your_password';
GRANT VIEW SERVER STATE TO [xitoring];
GRANT VIEW ANY DEFINITION TO [xitoring];Enable the MSSQL integration
Use the Xitoring dashboard or CLI to enable the MSSQL integration.
xitogent integrate mssql --enableConfigure alert thresholds (optional)
Set custom thresholds for buffer cache hit ratio, page life expectancy, or deadlock count to get notified when something needs attention.
Frequently asked questions
Start monitoring MSSQL today
Set up in under 60 seconds. No credit card required. Full metrics from day one.
Start Free TrialKeep exploring