IIS Monitoring
Monitor IIS application pool health, request queues, worker processes, and response metrics in real time with zero configuration.
Why monitor IIS?
Internet Information Services (IIS) is Microsoft's web server powering enterprise .NET applications and websites. Monitoring IIS is essential to track application pool recycling, request queue depth, worker process health, and ensure optimal performance for Windows-hosted web applications.
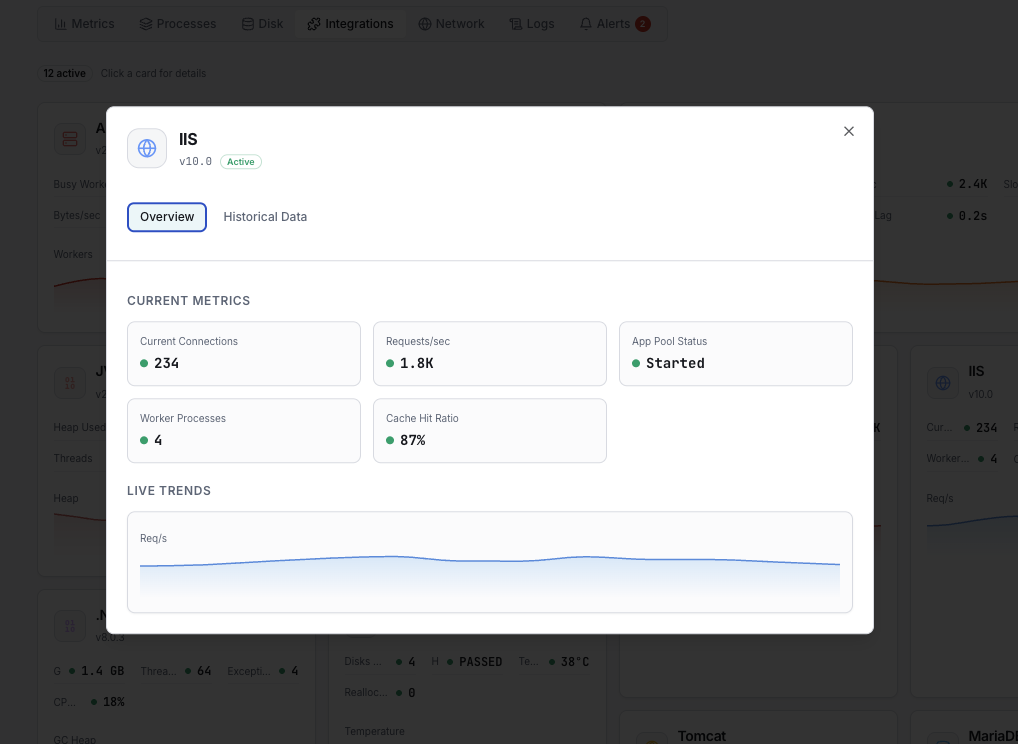
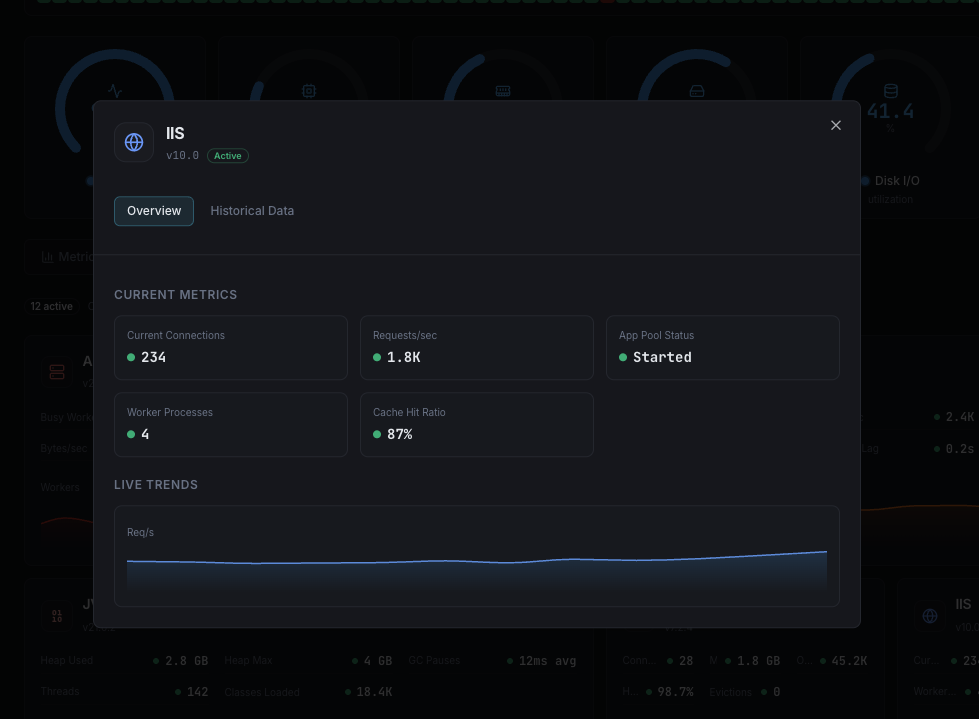
What we monitor
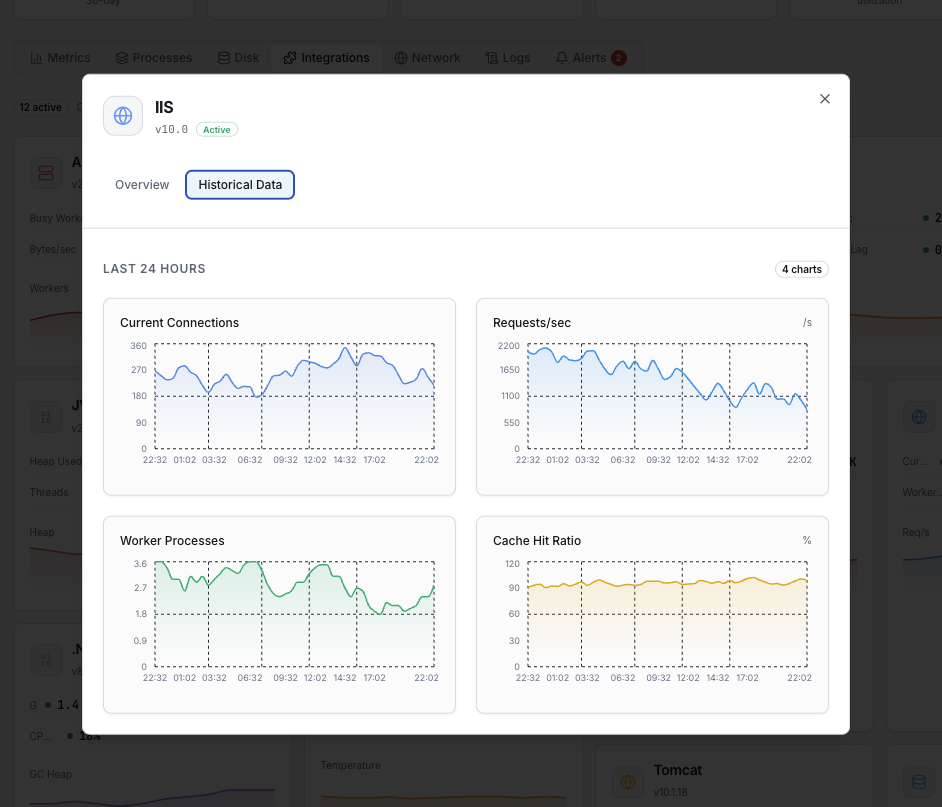
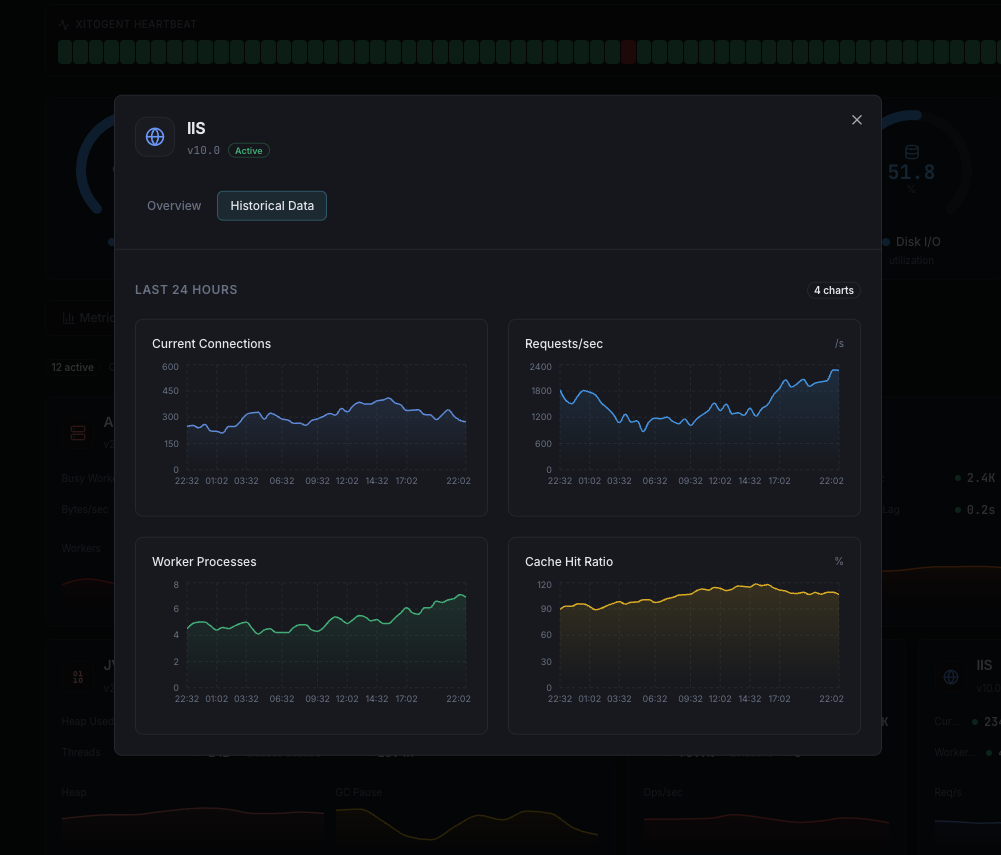
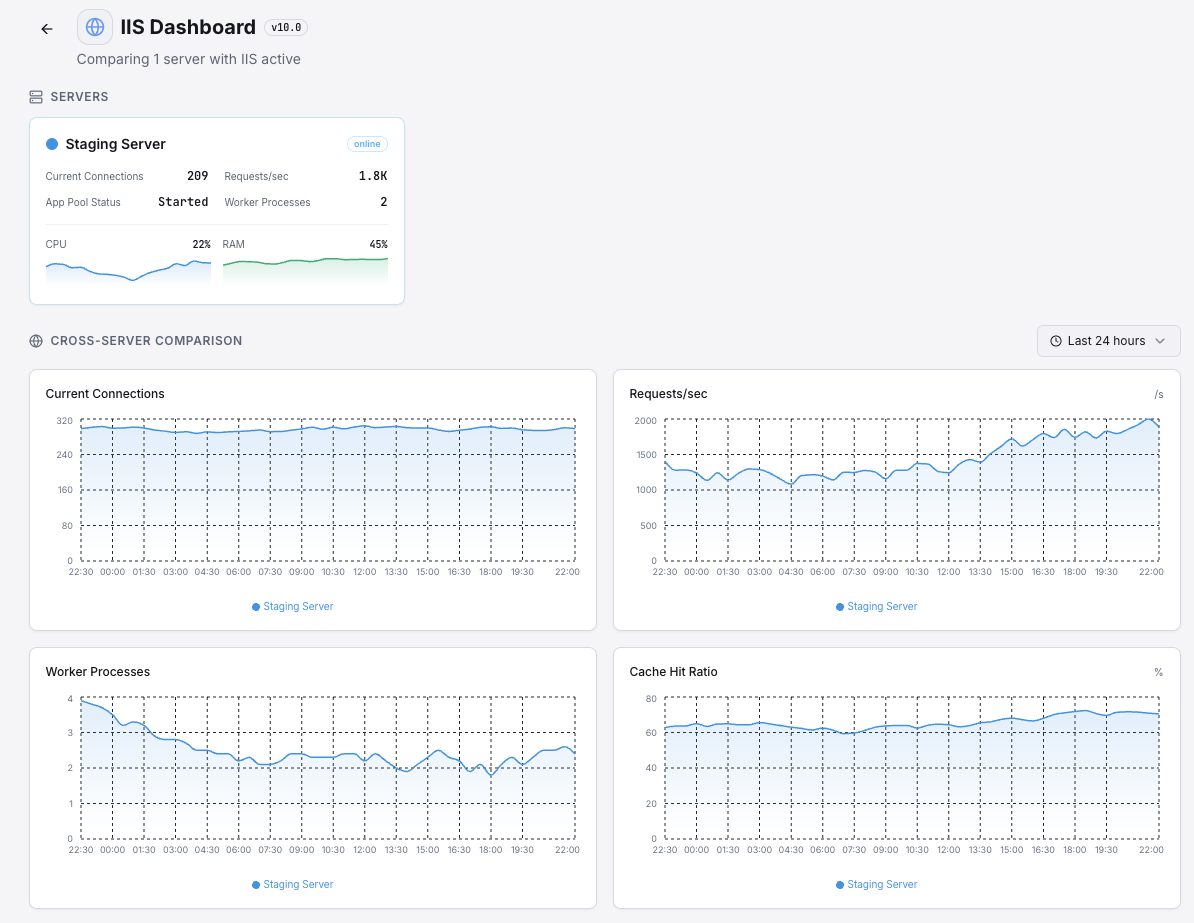
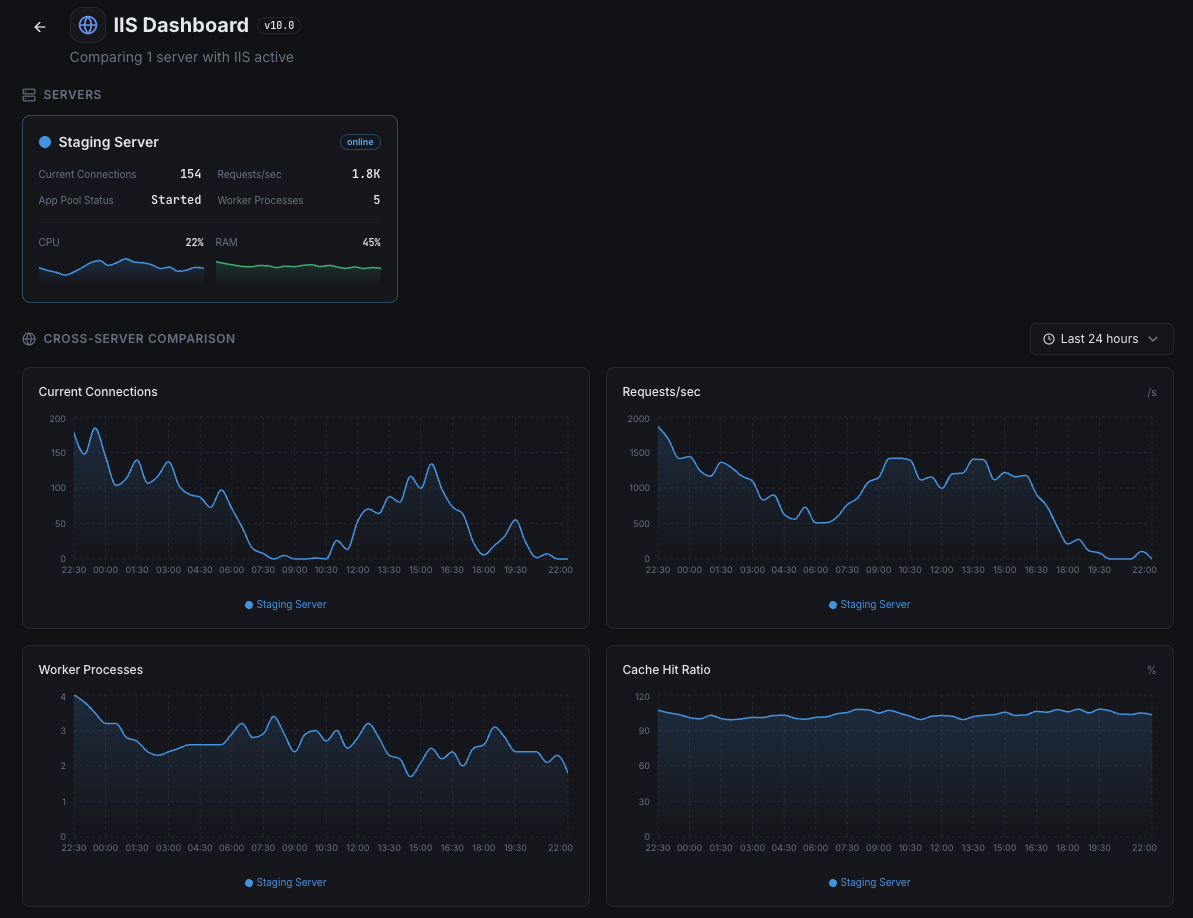
Current Requests
Number of requests currently being processed.
Request Queue Length
Requests waiting in queue for processing.
Application Pool Status
Health state of each application pool.
Worker Process CPU
CPU usage per IIS worker process.
HTTP Errors/sec
Rate of 4xx and 5xx HTTP errors.
Bytes Sent/Received
Network throughput for IIS.
Active Connections
Currently active client connections.
Cache Hit Ratio
IIS output cache effectiveness.
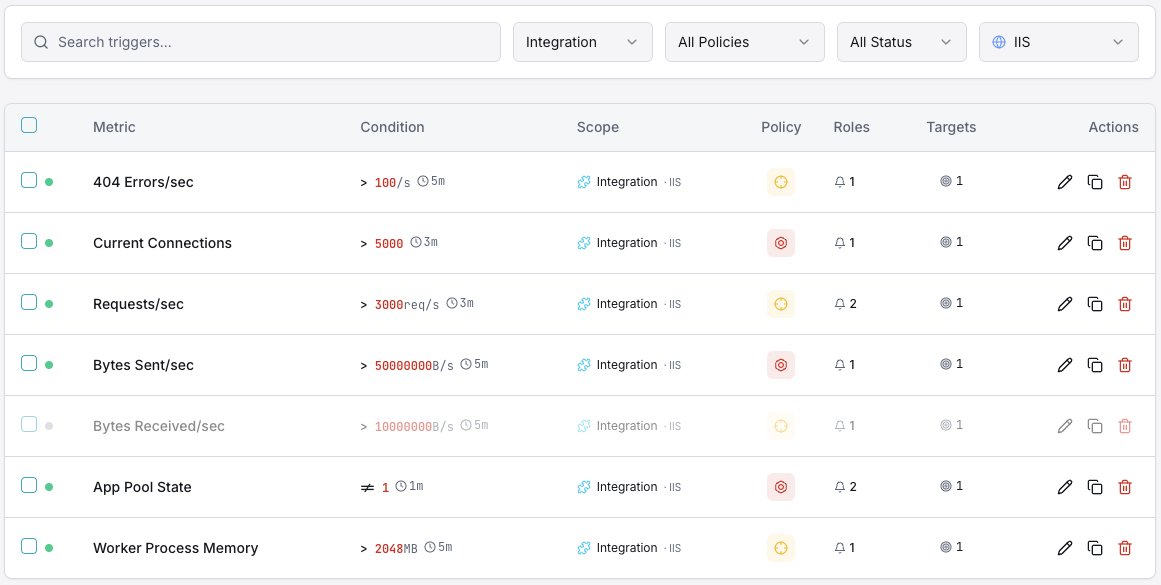
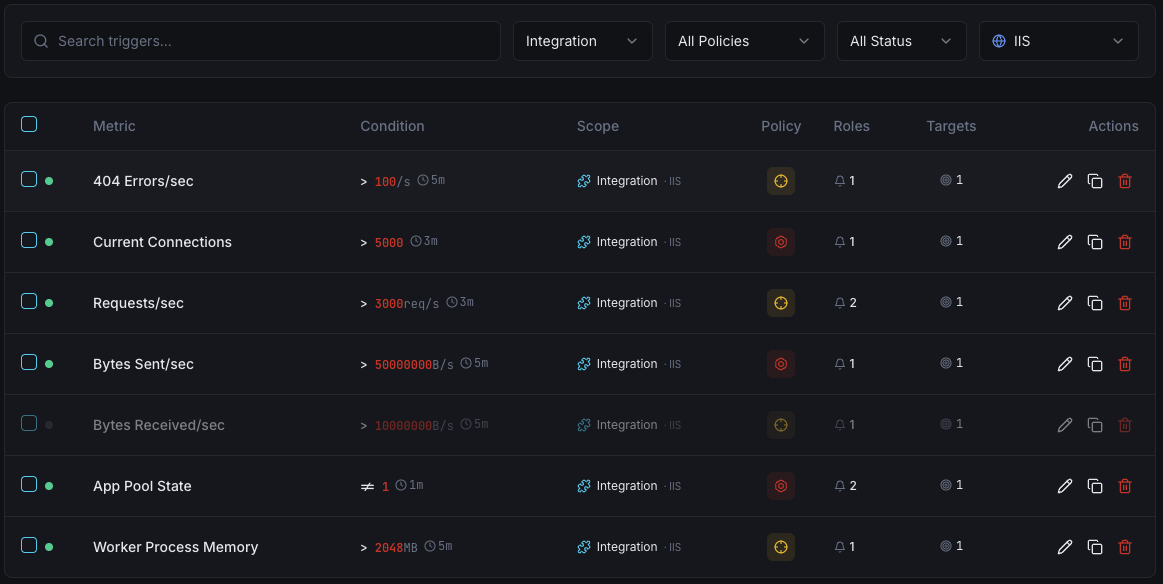
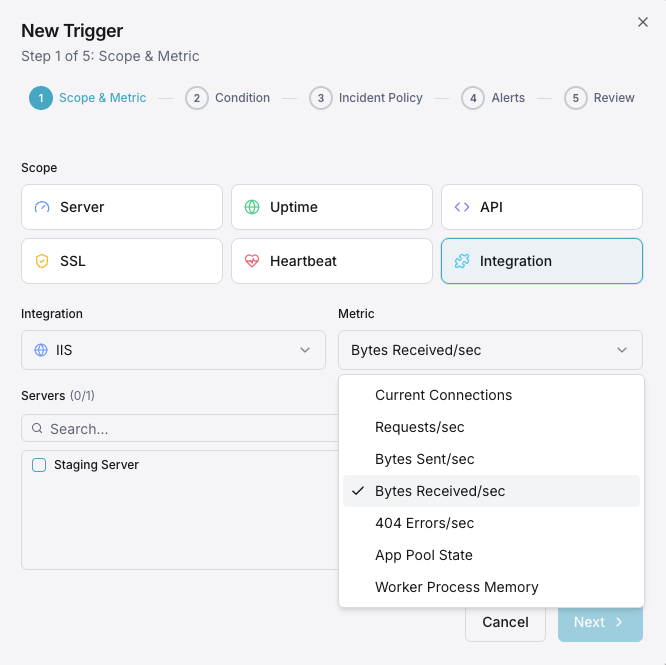
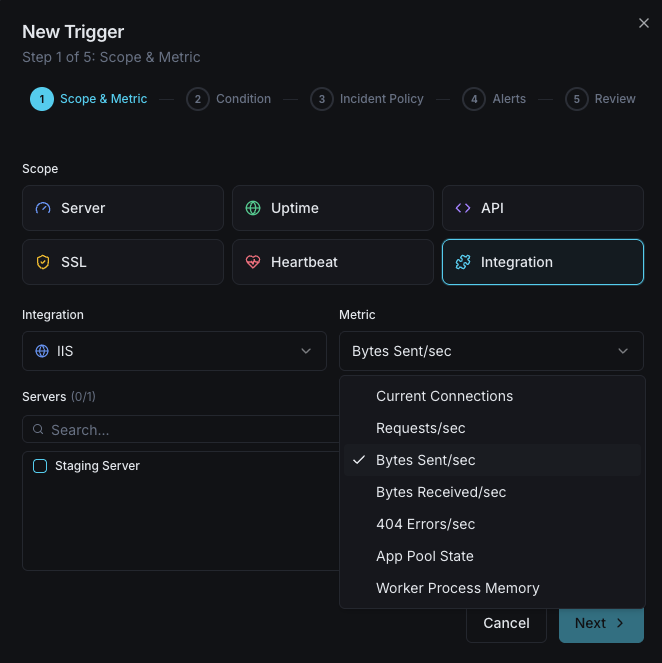
Configurable alert triggers
Set up custom triggers in your dashboard to get notified the moment IIS metrics cross your defined thresholds.
Request Queue
criticalFires when queue depth exceeds threshold, indicating processing bottleneck.
App Pool Recycling
warningAlerts when application pool recycles unexpectedly.
HTTP Error Rate
warningTriggers when error rate spikes.
Worker Process CPU
criticalFires on high CPU usage in worker processes.
Active Connections
warningAlerts when connections approach server limits.
Importance of IIS Monitoring
IIS runs mission-critical .NET applications and corporate intranets. Without monitoring, application pool crashes, queue buildup, and memory leaks can cause outages.
- Detect app pool crashes before users are affected
- Monitor request queues to prevent timeouts
- Track worker process memory to prevent leaks
- Identify HTTP error spikes early
Why Choose Xitoring
Native Windows Server support with easy installation and enterprise-grade monitoring.
- Native Windows installer
- 50+ global monitoring nodes
- Unified dashboard for all services
- Multi-channel alerting
- Historical data retention
Get started in minutes
Install Xitogent on Windows Server
Download and run the installer as Administrator.
# Download from https://xitoring.com/xitogent
# Run the installer as AdministratorEnable IIS integration
Enable via dashboard or CLI.
xitogent integrate iis --enableConfigure alerts (optional)
Set thresholds for request queues, error rates, or app pool health.
Frequently asked questions
Start monitoring IIS today
Set up in under 60 seconds. No credit card required. Full metrics from day one.
Start Free Trial