MySQL Monitoring
Monitor MySQL query performance, replication health, connection pools, and storage metrics in real time with zero configuration.
Why monitor MySQL?
MySQL is the world's most popular open-source relational database, powering millions of applications from startups to Fortune 500 enterprises. Monitoring MySQL is essential to detect slow queries, prevent connection pool exhaustion, track replication lag, and optimize storage usage. Xitoring's MySQL integration provides deep visibility into your database performance.
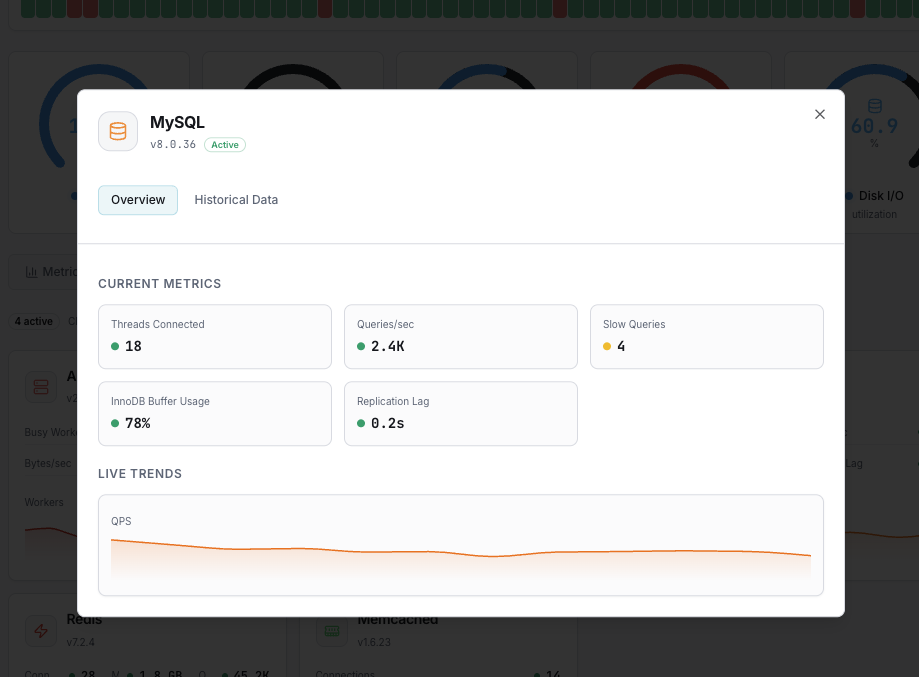
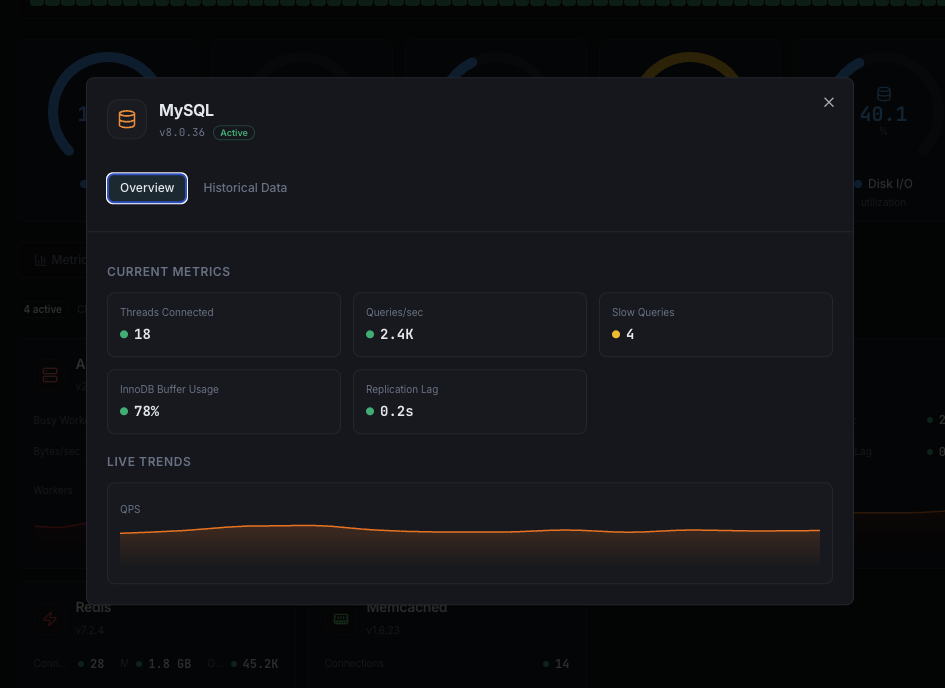
What we monitor
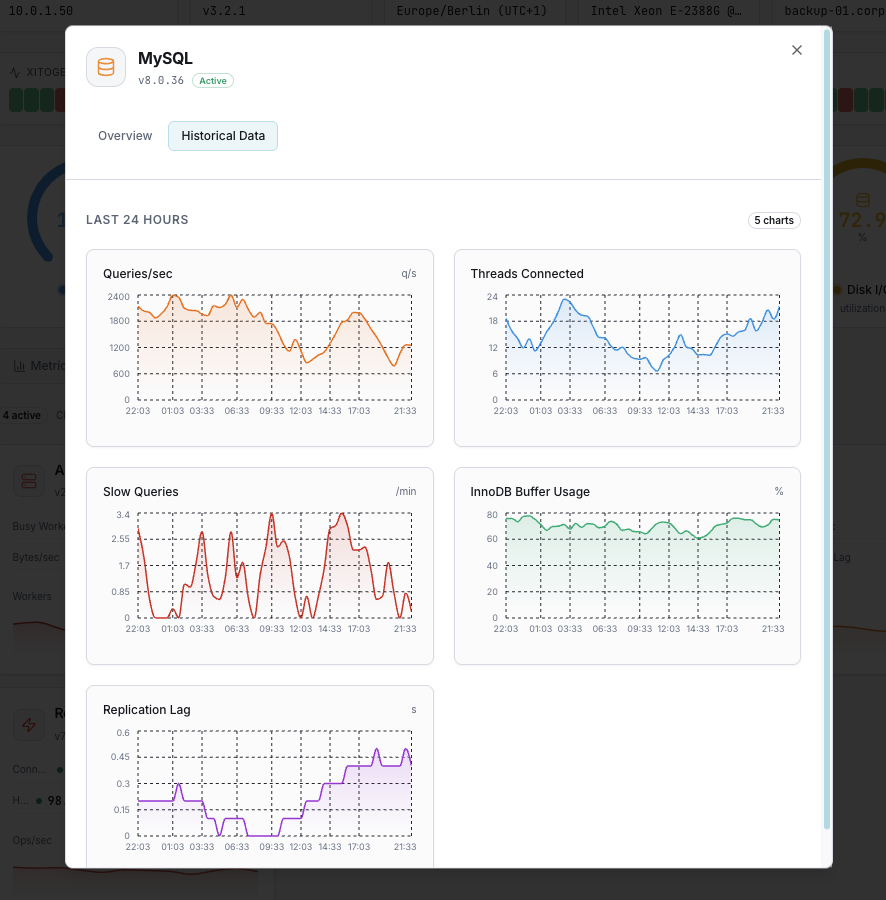
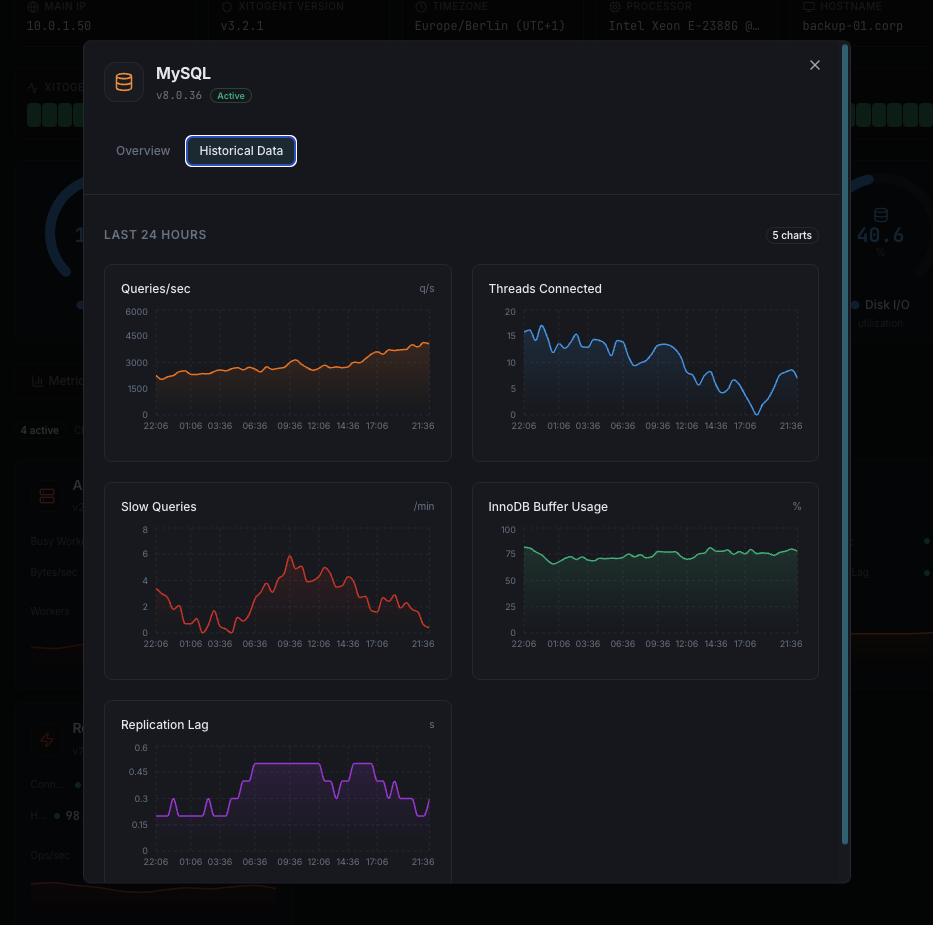
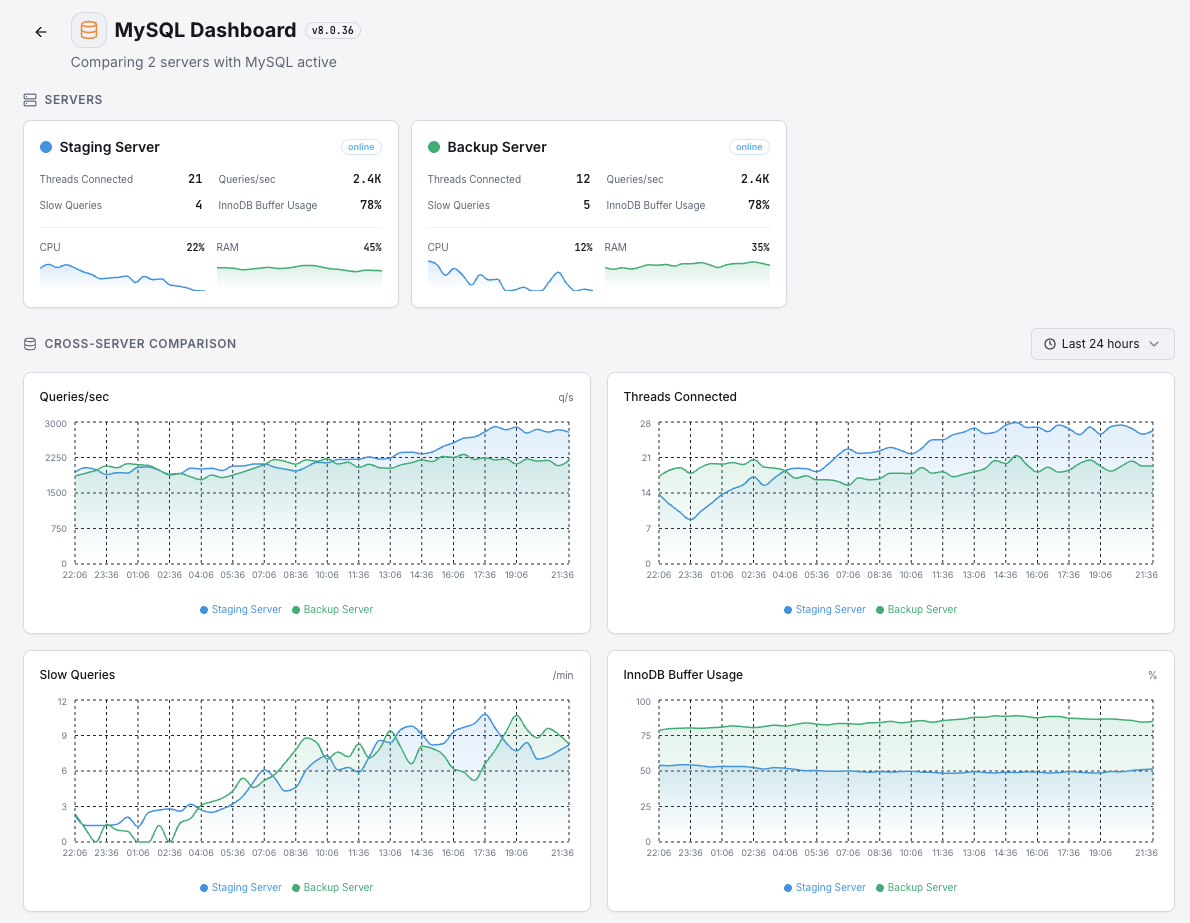
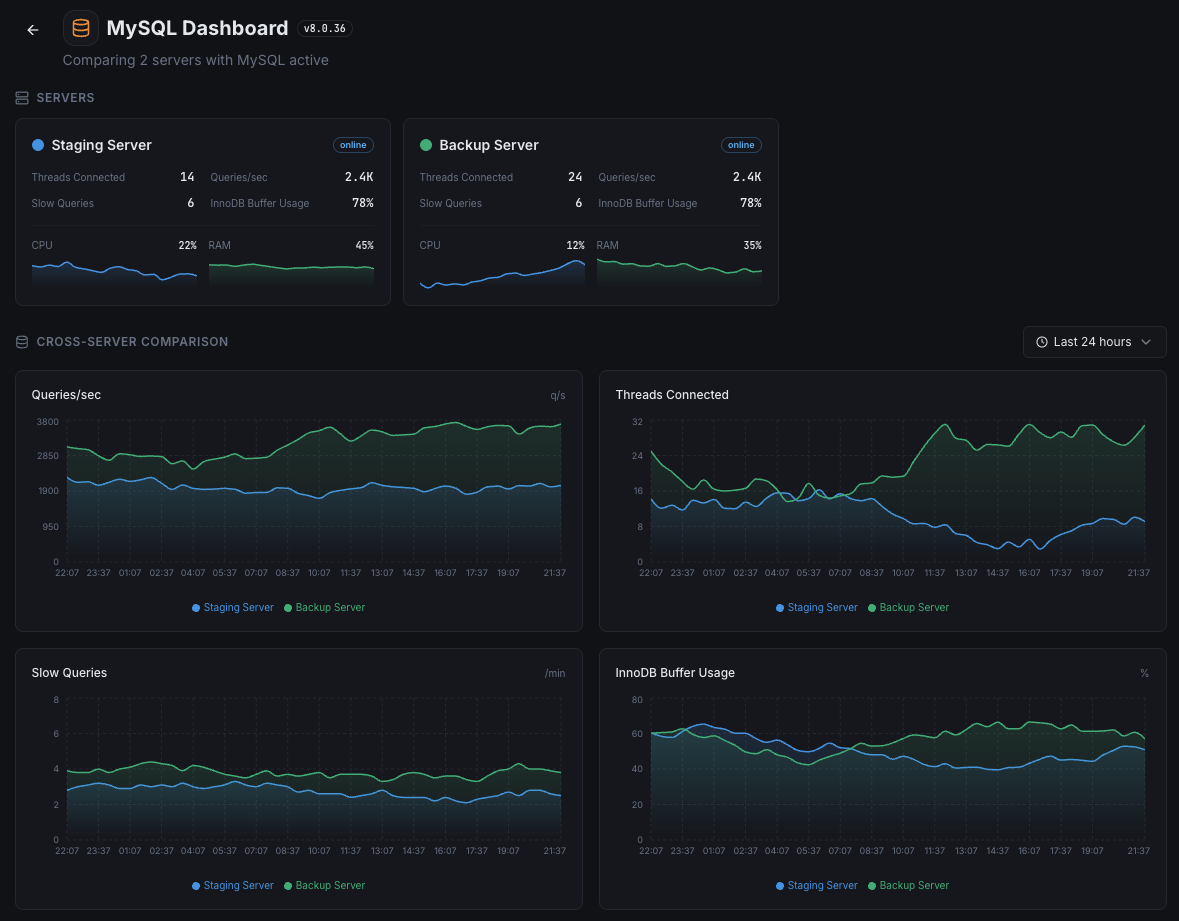
Queries per Second
Rate of SELECT, INSERT, UPDATE, and DELETE queries.
Active Connections
Number of currently active connections to MySQL.
Slow Queries
Count of queries exceeding the slow query threshold.
Replication Lag
Seconds behind the master in replication.
InnoDB Buffer Pool
Buffer pool utilization and hit ratio.
Thread States
Distribution of thread states (running, sleeping, locked).
Table Locks
Rate of table lock waits and immediate grants.
Temporary Tables
Rate of temporary tables created on disk.
Bytes Sent/Received
Network throughput to and from MySQL.
Aborted Connections
Failed connection attempts and aborted clients.
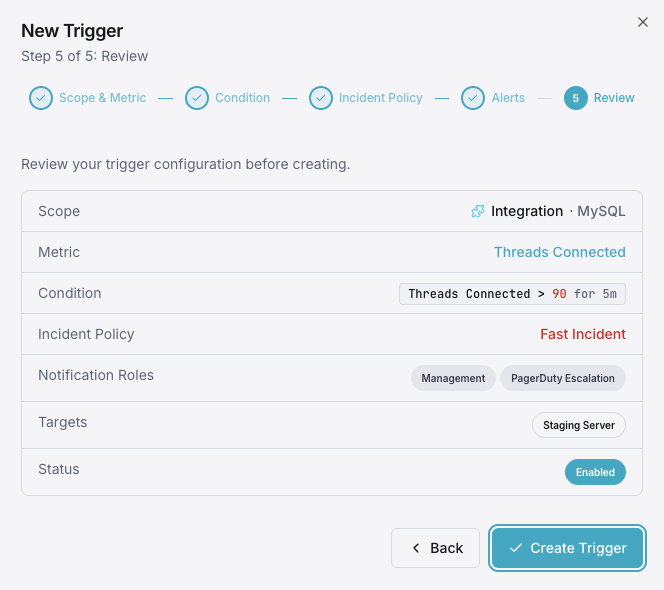
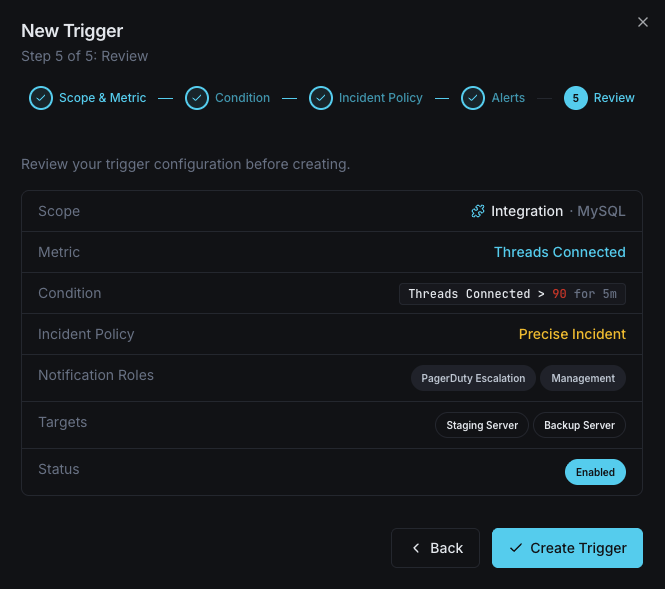
Configurable alert triggers
Set up custom triggers in your dashboard to get notified the moment MySQL metrics cross your defined thresholds.
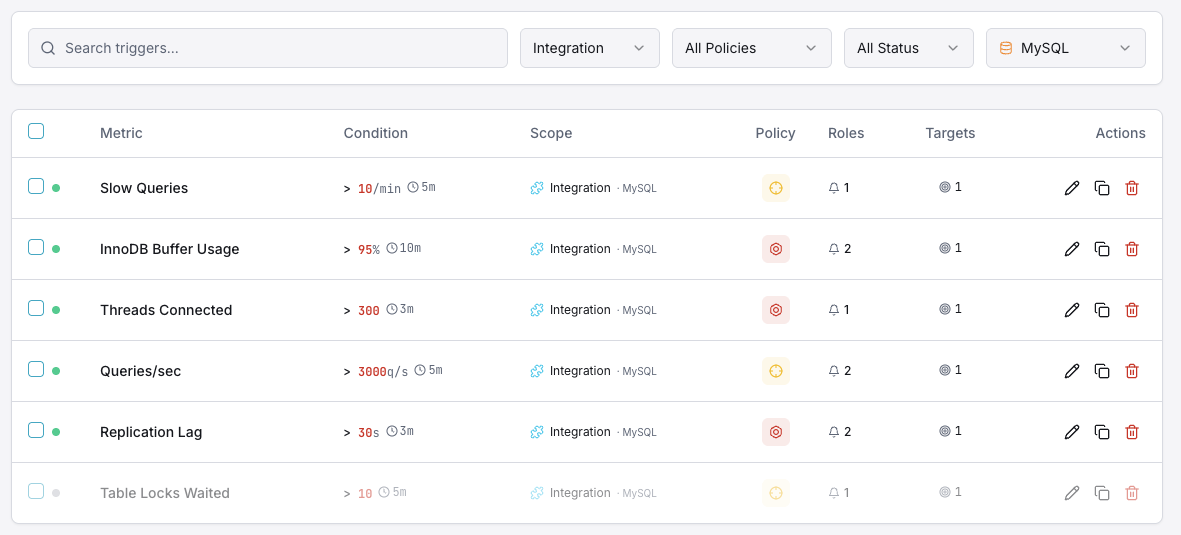
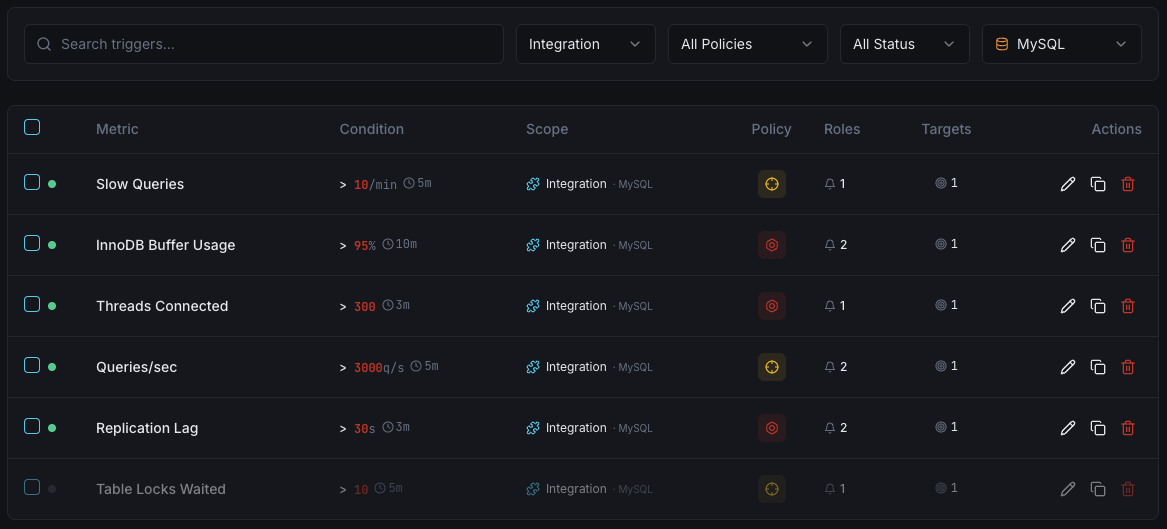
Active Connections
criticalFires when active connections approach max_connections, risking new connection refusal and application errors.
Replication Lag
criticalTriggers when replication falls behind, risking data inconsistency between master and replicas.
Slow Queries
warningAlerts when slow query count exceeds threshold, indicating performance degradation.
InnoDB Buffer Pool
warningFires when buffer pool hit ratio drops, indicating excessive disk I/O.
Aborted Connections
warningTriggers on connection failure spikes, indicating authentication or network issues.
Table Lock Waits
criticalAlerts when lock contention increases, degrading query performance.
Importance of MySQL Monitoring
MySQL handles critical data for millions of applications. Without proper monitoring, slow queries, replication drift, and connection exhaustion can lead to outages and data inconsistency.
- Detect slow queries before they impact user experience
- Prevent connection pool exhaustion with threshold alerts
- Monitor replication for data consistency across replicas
- Track InnoDB performance for optimal storage engine health
- Identify lock contention and query bottlenecks early
Why Choose Xitoring
Xitoring delivers enterprise-grade MySQL monitoring with zero-config setup. Our lightweight agent auto-discovers your MySQL instances, starts collecting metrics in under 60 seconds, and integrates with your existing notification channels.
- One-command install — no complex YAML or config files
- 50+ global monitoring nodes for low-latency checks
- Unified dashboard for servers, databases, and uptime
- Flexible alerting via Slack, PagerDuty, Telegram & more
- Historical data retention for capacity planning & audits
Get started in minutes
Install Xitogent on your server
If you haven't already, install the lightweight Xitogent monitoring agent on your server.
curl -s https://xitoring.com/install.sh | sudo bashCreate a monitoring user in MySQL
Create a dedicated read-only user for Xitogent to collect metrics:
CREATE USER 'xitoring'@'localhost' IDENTIFIED BY 'your_secure_password';
GRANT PROCESS, REPLICATION CLIENT, SELECT ON *.* TO 'xitoring'@'localhost';
FLUSH PRIVILEGES;Enable the MySQL integration
Use the Xitoring dashboard or CLI to enable the MySQL integration with the monitoring credentials.
sudo xitogent integrate mysql --enableConfigure alert thresholds (optional)
Set custom thresholds for metrics like replication lag, slow queries, or connection count to get notified when something needs attention.
Frequently asked questions
Start monitoring MySQL today
Set up in under 60 seconds. No credit card required. Full metrics from day one.
Start Free TrialKeep exploring