RabbitMQ Monitoring
Monitor RabbitMQ queue depths, consumer counts, message rates, and node health in real time with zero configuration.
Why monitor RabbitMQ?
RabbitMQ is the most widely deployed open-source message broker, enabling asynchronous communication between microservices. Monitoring RabbitMQ is essential to prevent queue buildup, detect consumer failures, track message delivery rates, and ensure cluster stability. Xitoring's RabbitMQ integration provides full visibility into your messaging infrastructure.
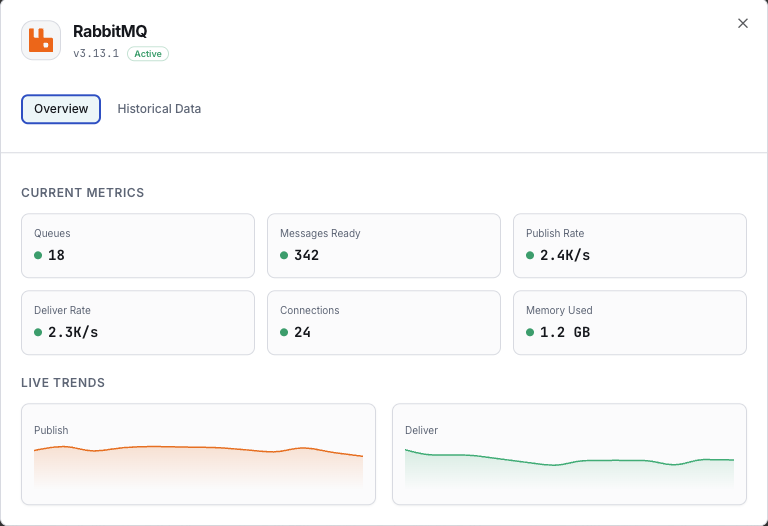
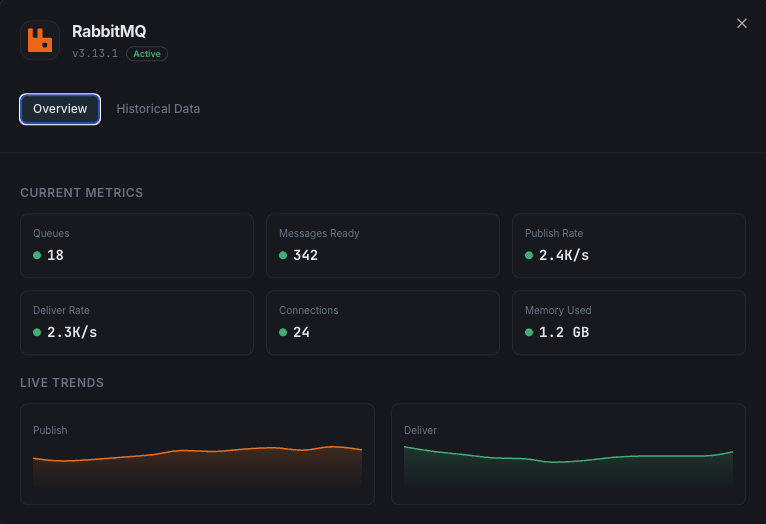
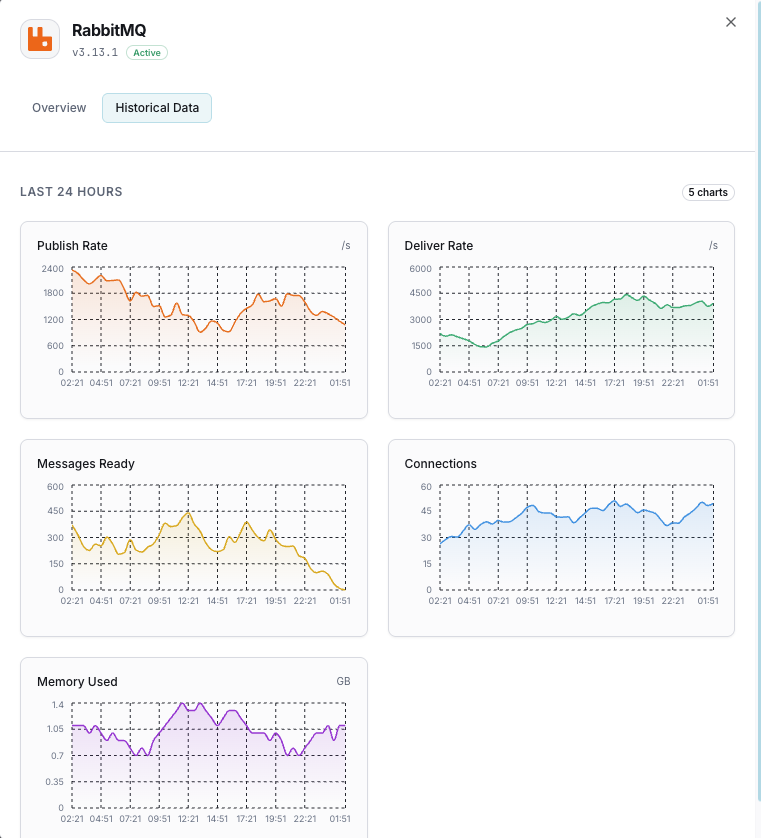
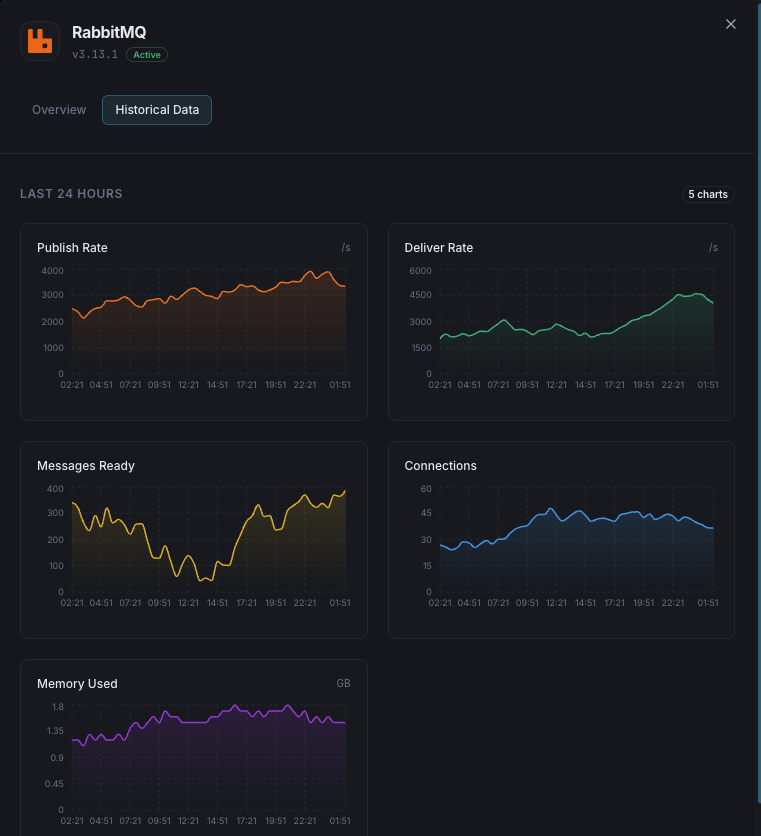
What we monitor
Queue Depth
Number of messages ready and unacknowledged in each queue.
Message Rates
Publish, deliver, acknowledge, and redelivery rates per second.
Consumer Count
Number of active consumers attached to each queue.
Node Memory
Memory used by each RabbitMQ node including binary and queue memory.
Disk Free Space
Available disk space on each node against the configured alarm threshold.
Connection Count
Total client connections and channels across the cluster.
Exchange Rates
Message rates through each exchange (publish in/out).
Unroutable Messages
Messages that couldn't be routed to any queue.
File Descriptors
Used vs available file descriptors on each node.
Erlang Processes
Number of Erlang processes running on each node.
Cluster Partitions
Network partition events between cluster nodes.
Dead Letter Messages
Messages routed to dead letter exchanges due to rejection or TTL expiry.
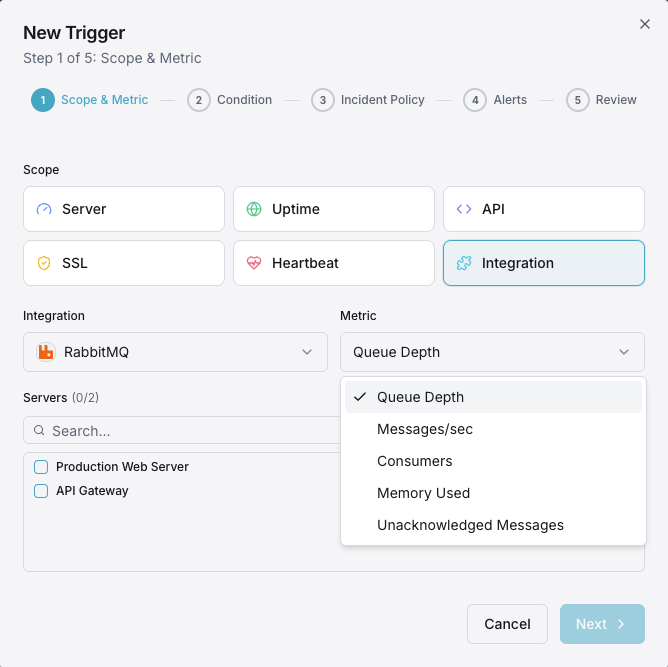
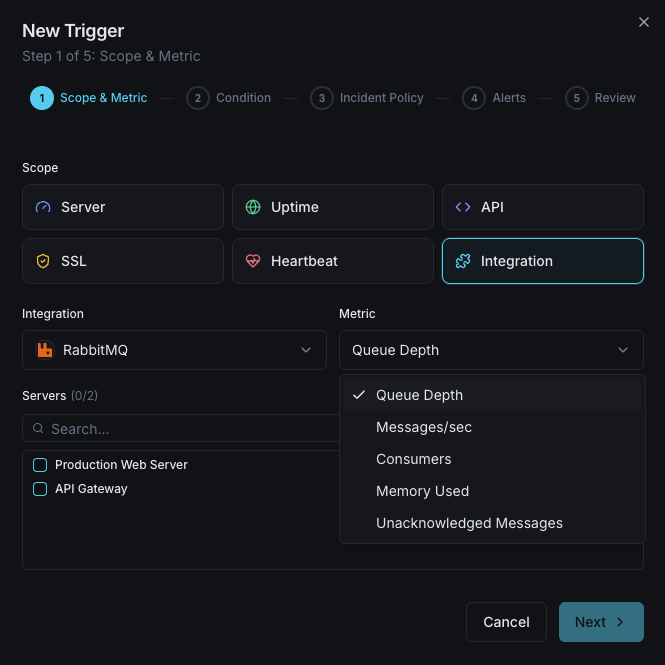
Configurable alert triggers
Set up custom triggers in your dashboard to get notified the moment RabbitMQ metrics cross your defined thresholds.
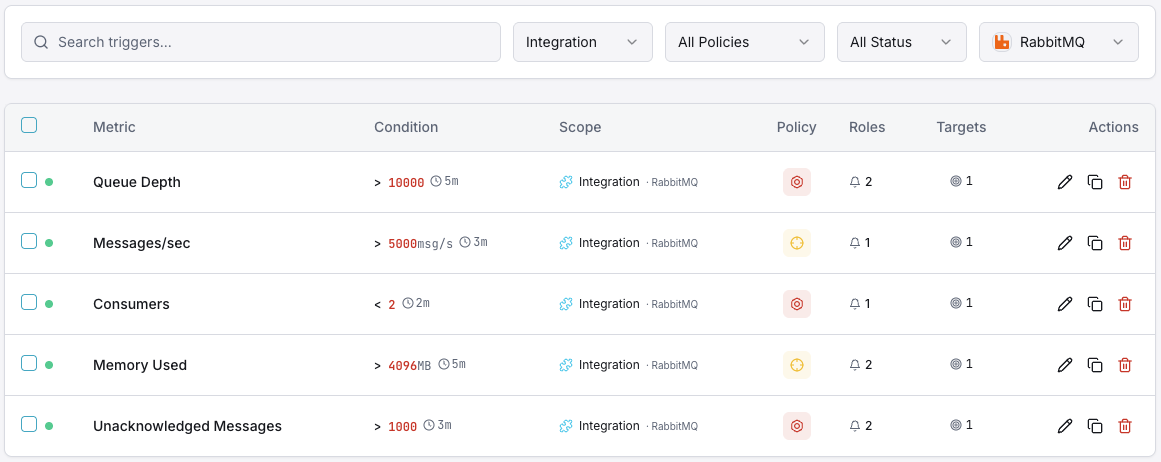
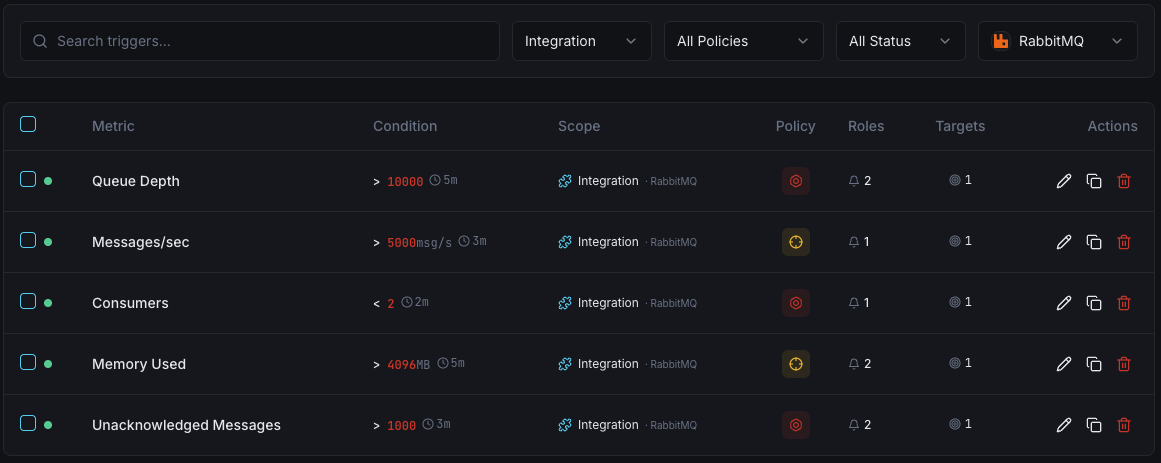
Queue Depth
criticalFires when messages pile up in a queue, indicating consumers can't keep up with producers.
Consumer Count
warningTriggers when consumers drop below threshold, risking message processing delays.
Node Memory
criticalAlerts when node memory approaches the high watermark, risking flow control activation.
Message Rate
warningFires when publish or delivery rates deviate significantly from baseline.
Disk Free Alarm
criticalTriggers when disk space drops below the configured threshold, blocking all publishers.
Unacknowledged Messages
warningAlerts when unacked messages grow, indicating slow or stuck consumers.
Importance of RabbitMQ Monitoring
RabbitMQ is the backbone of event-driven architectures — handling order processing, notifications, data pipelines, and inter-service communication. Without monitoring, queue saturation, consumer failures, and memory pressure can cascade into full system outages.
- Detect queue buildup before it causes application timeouts
- Monitor consumer health to ensure message processing continuity
- Track memory and disk usage to prevent flow control activation
- Identify unroutable and dead-lettered messages early
- Ensure cluster partition recovery for high availability
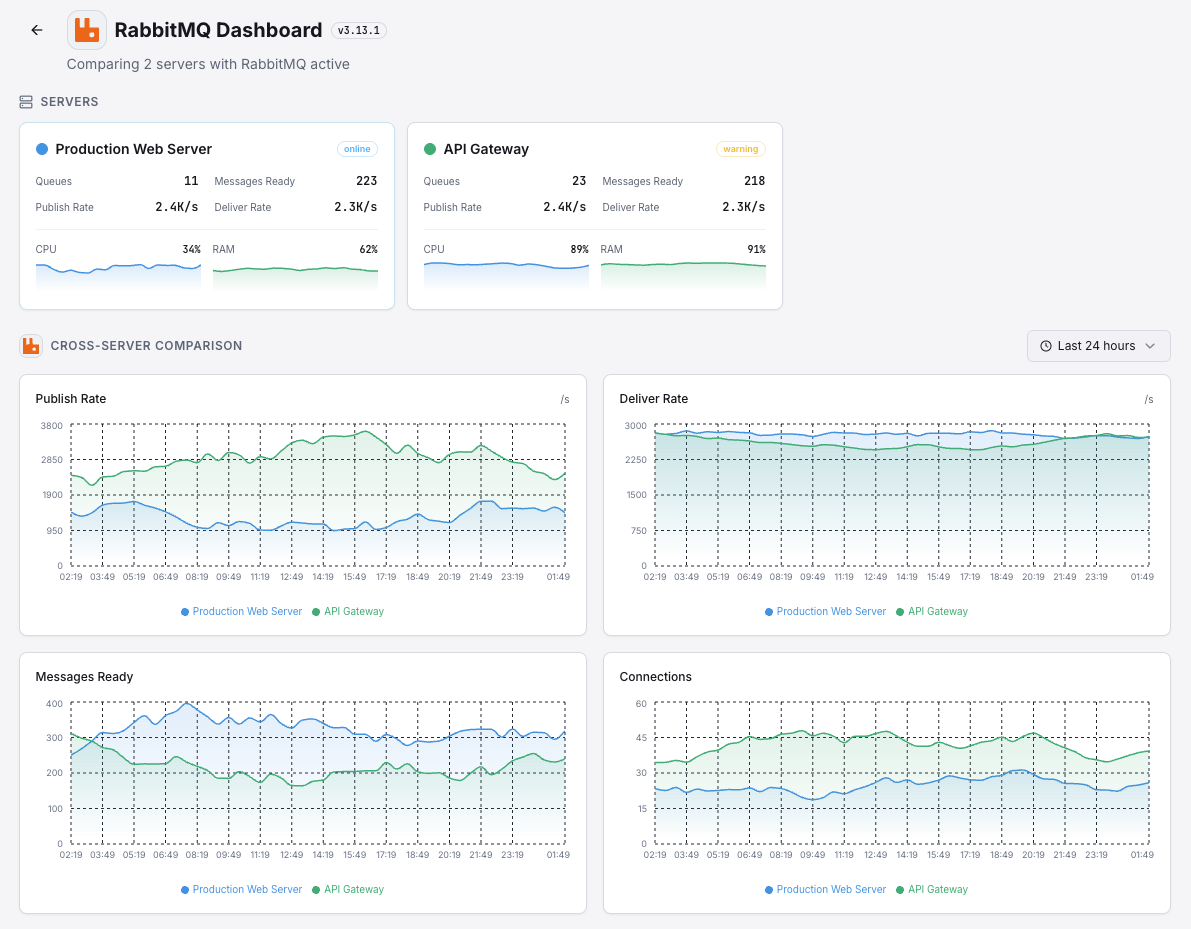
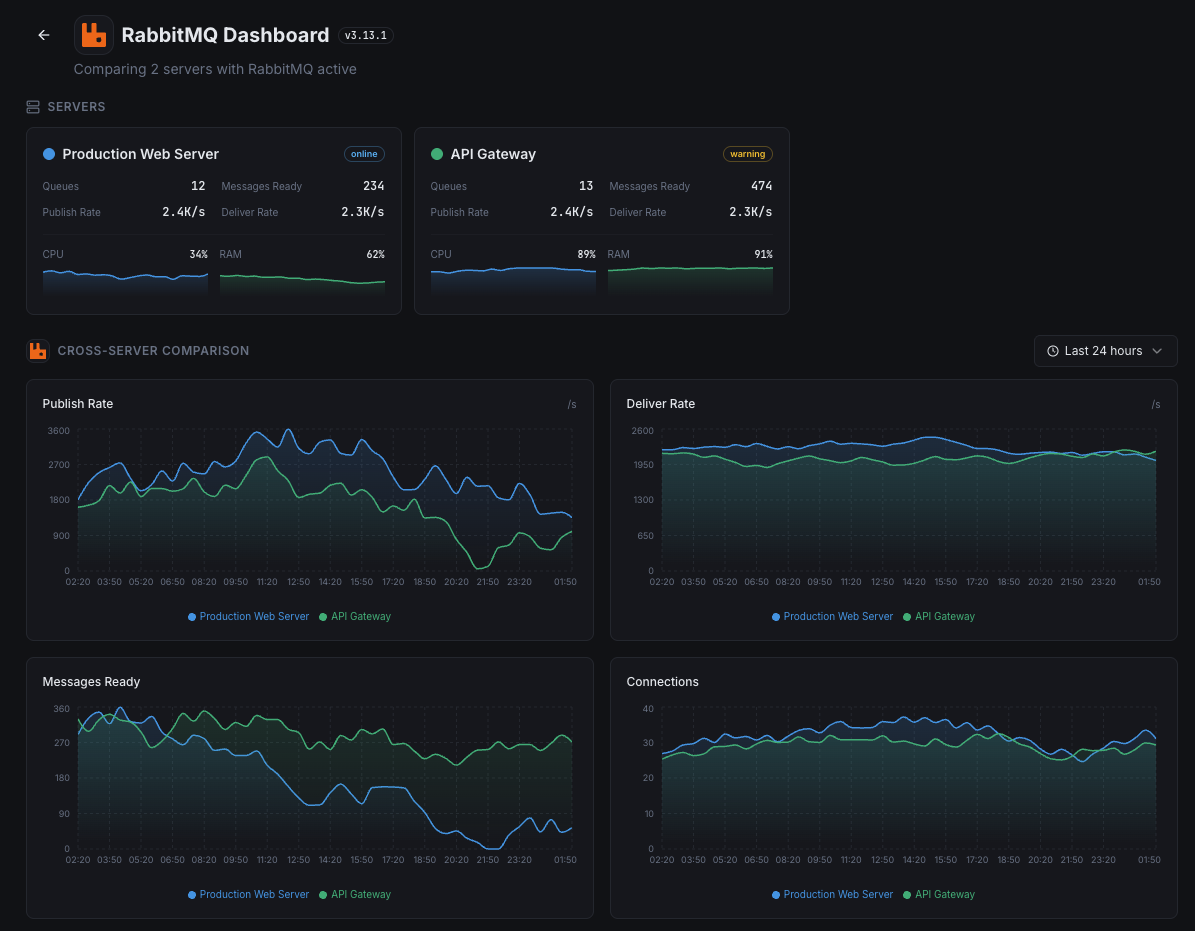
Why Choose Xitoring
Xitoring delivers enterprise-grade RabbitMQ monitoring with zero-config setup. Our lightweight agent auto-discovers your RabbitMQ nodes, starts collecting metrics in under 60 seconds, and integrates with your existing notification channels.
- One-command install — no complex YAML or config files
- 50+ global monitoring nodes for low-latency checks
- Unified dashboard for servers, message brokers, and uptime
- Flexible alerting via Slack, PagerDuty, Telegram & more
- Historical data retention for capacity planning & audits
Get started in minutes
Install Xitogent on your server
If you haven't already, install the lightweight Xitogent monitoring agent on your server.
curl -s https://xitoring.com/install.sh | sudo bashEnable the RabbitMQ management plugin
Xitogent collects metrics via the RabbitMQ management API. Enable the plugin if not already active:
rabbitmq-plugins enable rabbitmq_managementEnable the RabbitMQ integration
Use the Xitoring dashboard or CLI to enable the RabbitMQ integration. Xitogent will auto-detect your instance.
sudo xitogent integrate rabbitmq --enableConfigure alert thresholds (optional)
Set custom thresholds for queue depth, consumer count, or memory usage to get notified when something needs attention.
Frequently asked questions
Start monitoring RabbitMQ today
Set up in under 60 seconds. No credit card required. Full metrics from day one.
Start Free TrialKeep exploring