Nginx Monitoring
Monitor Nginx performance, active connections, request throughput, and upstream health in real time with zero configuration.
Why monitor Nginx?
Nginx is the world's most popular reverse proxy and web server, handling billions of requests daily across the internet. Monitoring Nginx is critical to ensuring fast response times, detecting upstream failures, and maintaining high availability. Xitoring's Nginx integration provides deep visibility into your server's connection states, request rates, and performance metrics via the stub_status module.
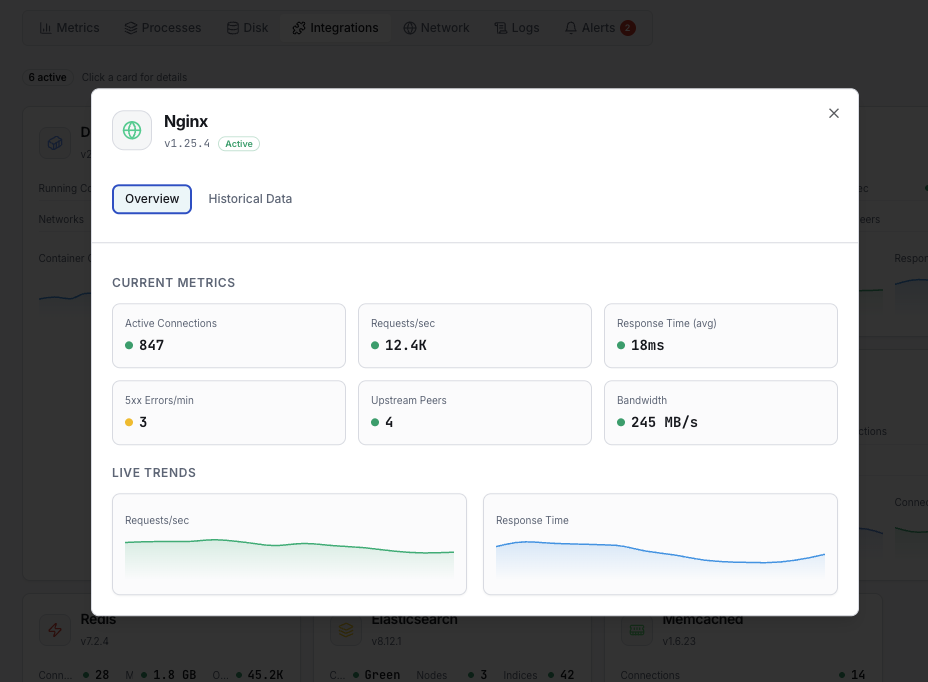
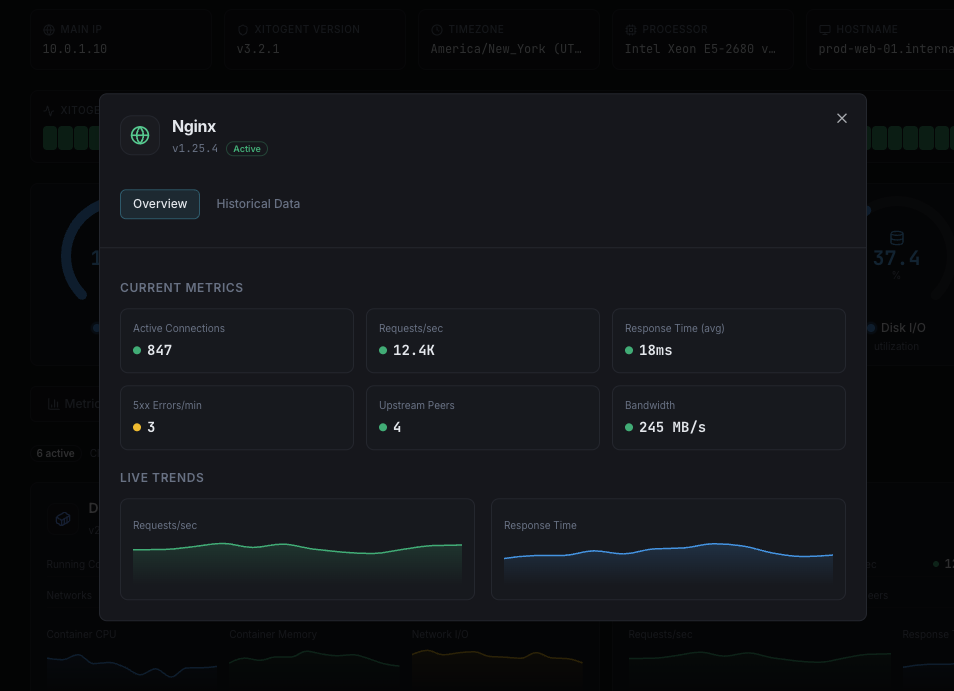
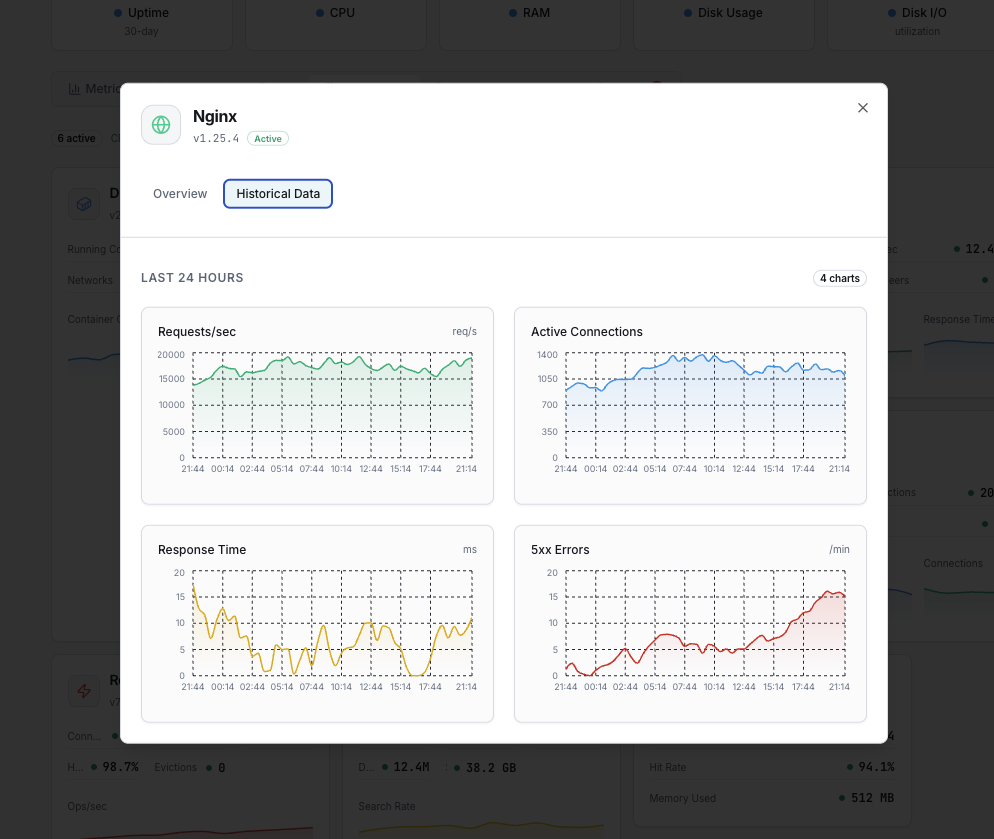
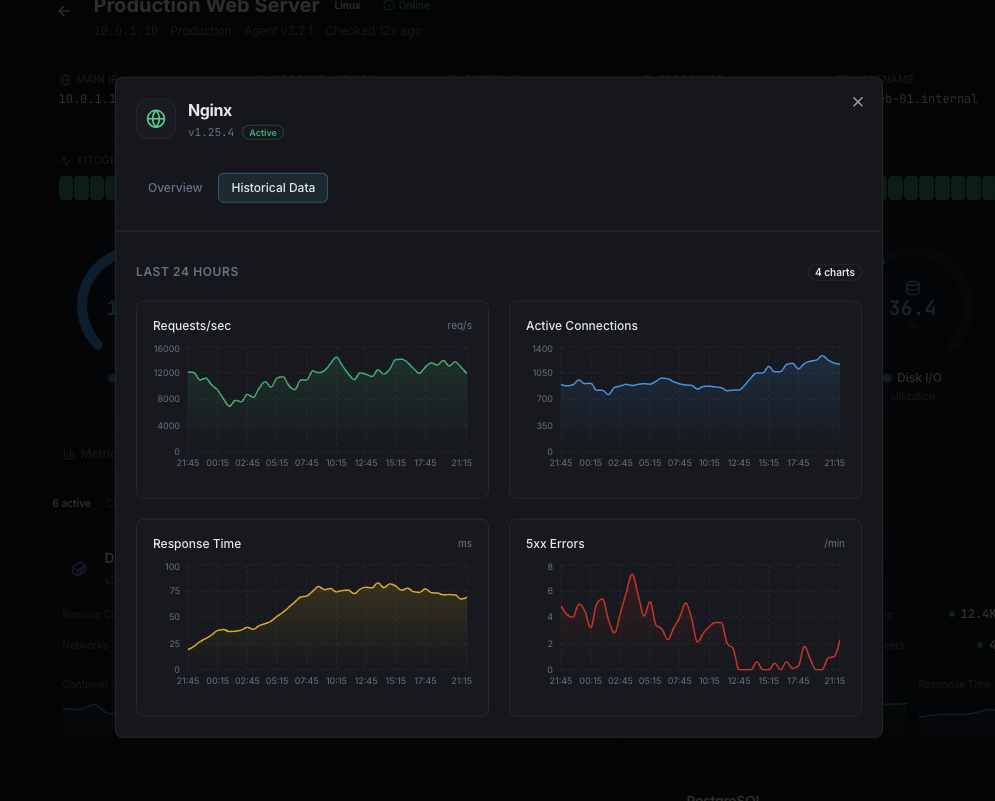
What we monitor
Active Connections
Number of currently active client connections including waiting connections.
Accepts
Total number of accepted client connections since the server started.
Handled
Total number of handled connections. Usually equals accepts unless resource limits hit.
Requests
Total number of client requests processed by the server.
Reading
Number of connections where Nginx is reading the request header.
Writing
Number of connections where Nginx is writing the response back to the client.
Waiting
Number of keep-alive connections waiting for the next request.
Requests per Second
Rate of incoming requests calculated from total request count.
Connections per Second
Rate of new connections being accepted by the server.
Response Time
Average time taken to process and respond to client requests.
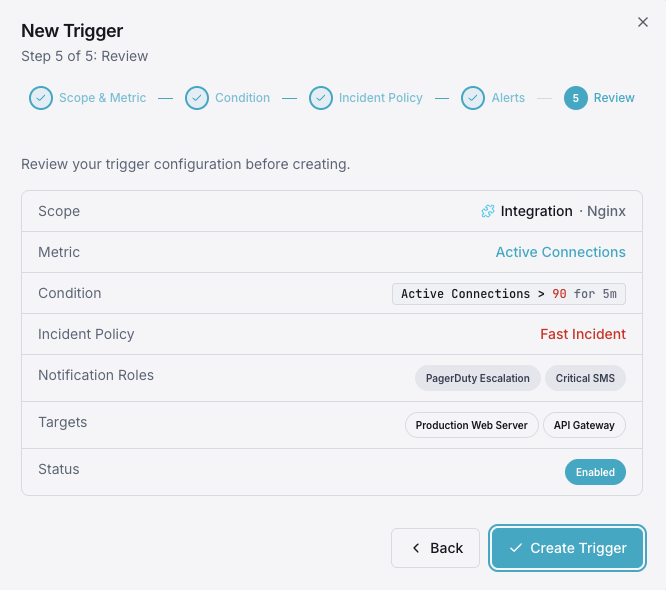
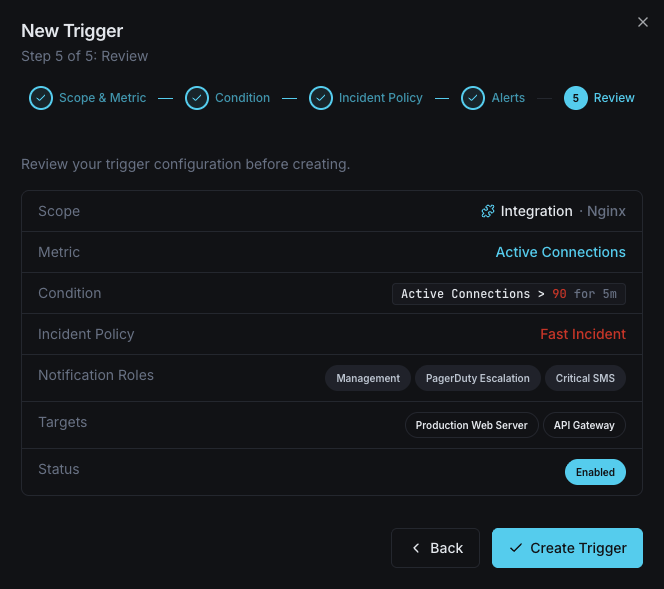
Configurable alert triggers
Set up custom triggers in your dashboard to get notified the moment Nginx metrics cross your defined thresholds.
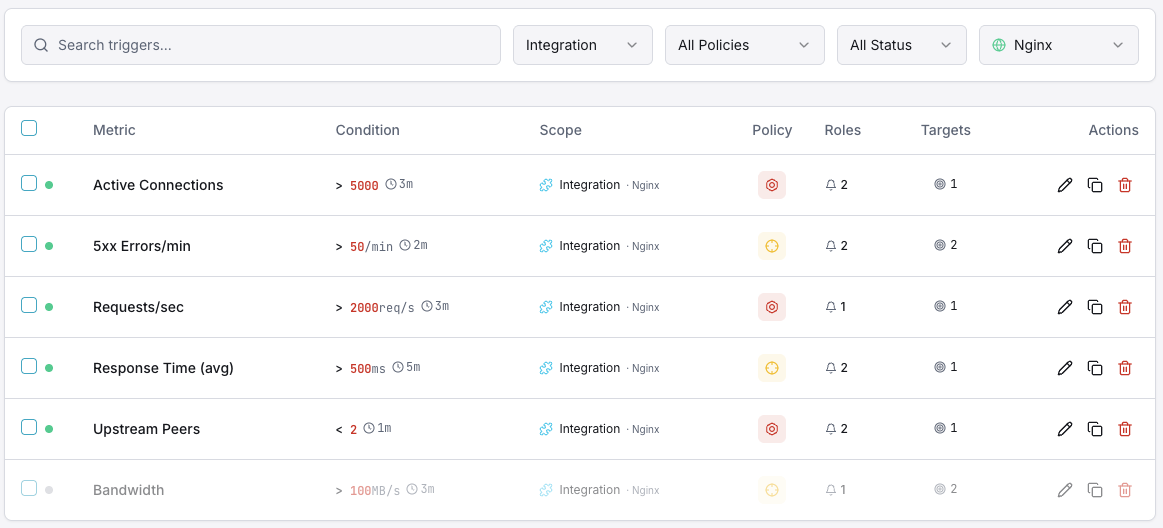
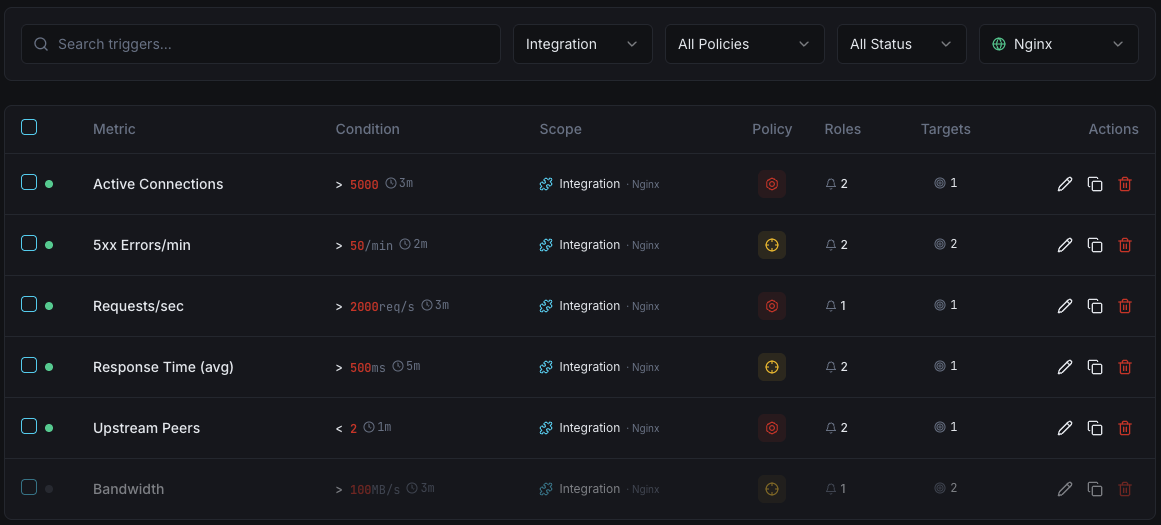
Active Connections
warningFires when the number of active connections exceeds your threshold, indicating the server is under heavy load.
Waiting Connections
warningTriggers when waiting (keep-alive) connections exceed the threshold, which may indicate slow clients or upstream delays.
Requests per Second
criticalAlerts when request rate exceeds normal baselines, useful for detecting traffic surges or DDoS patterns.
Writing Connections
warningFires when too many connections are in the writing state, signaling potential response bottlenecks.
Dropped Connections
criticalTriggers when the difference between accepts and handled increases, indicating resource exhaustion.
Response Time
criticalAlerts when average response time crosses your defined limit, signaling degraded performance.
Importance of Nginx Monitoring
Nginx powers over 35% of all web servers globally and is the backbone of modern microservices architectures. Without proper monitoring, connection saturation, upstream failures, and performance degradation can go undetected.
- Detect connection saturation before users experience timeouts
- Identify upstream server failures and slow backends
- Prevent cascading failures in reverse proxy configurations
- Maintain SLA compliance with real-time performance visibility
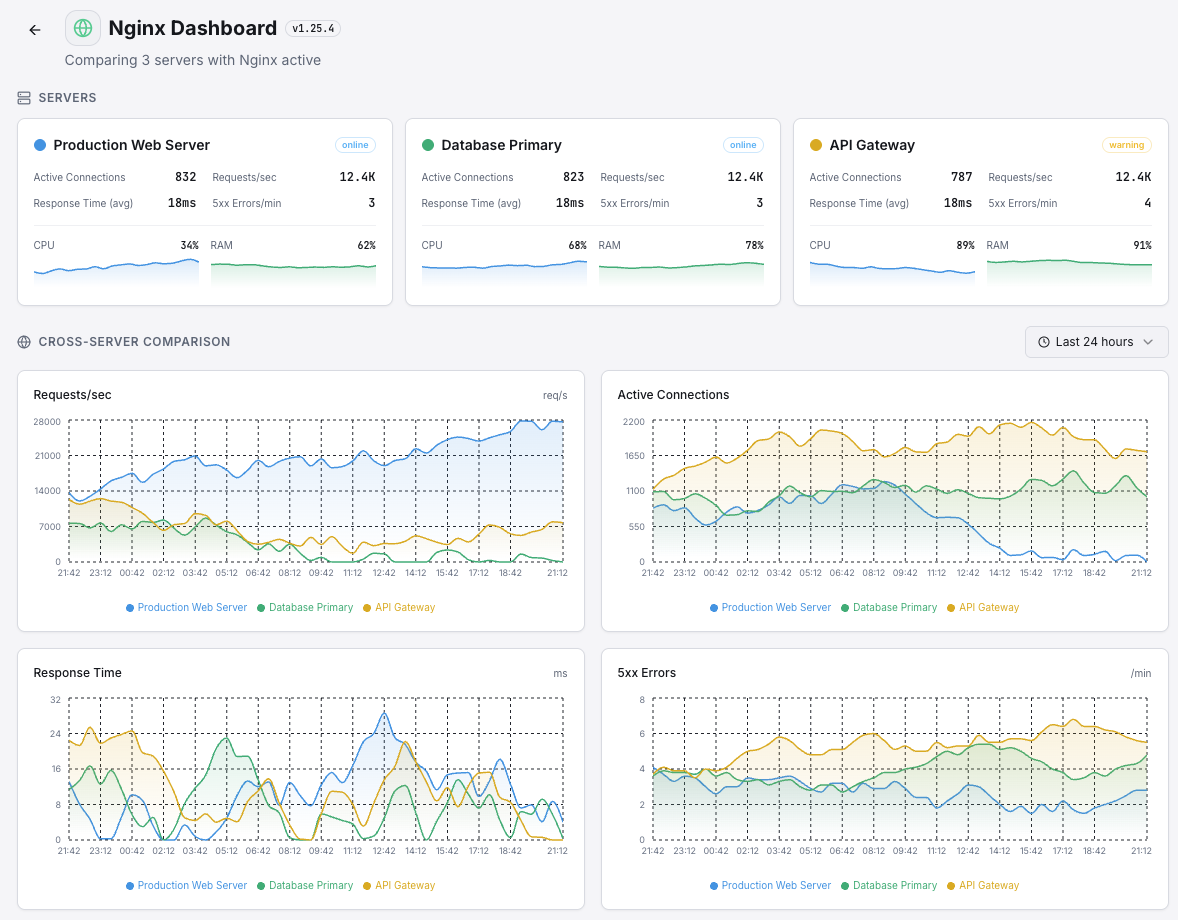
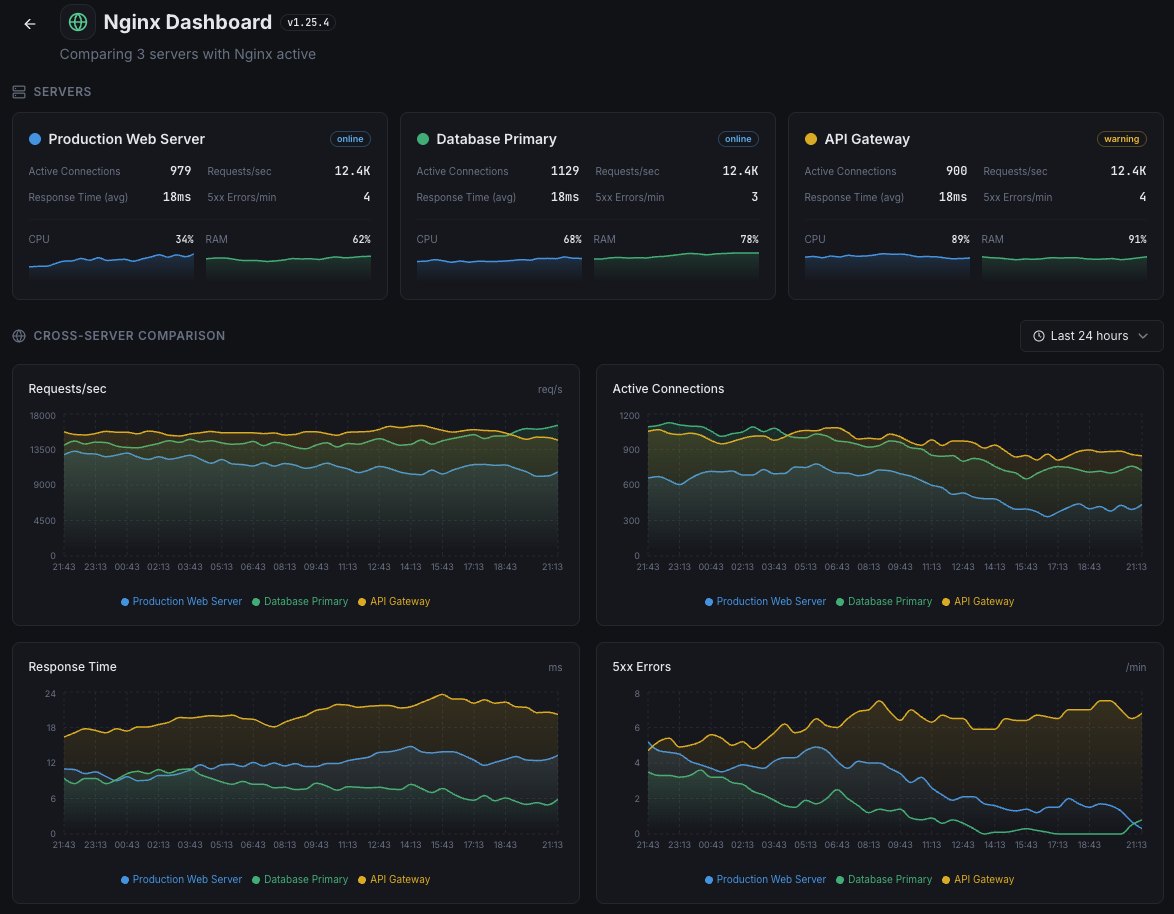
- Optimize load balancing with connection state analytics
Why Choose Xitoring
Xitoring delivers enterprise-grade Nginx monitoring with zero-config setup. Our lightweight agent auto-discovers your Nginx instances, starts collecting metrics in under 60 seconds, and integrates with your existing notification channels.
- One-command install — no complex YAML or config files
- 50+ global monitoring nodes for low-latency checks
- Unified dashboard for servers, services, and uptime
- Flexible alerting via Slack, PagerDuty, Telegram & more
- Historical data retention for capacity planning & audits
Get started in minutes
Install Xitogent on your server
If you haven't already, install the lightweight Xitogent monitoring agent on your server.
curl -s https://xitoring.com/install.sh | sudo bashEnable stub_status in Nginx
Add a stub_status location block to your Nginx configuration:
server {
    listen 80;
    location /nginx_status {
        stub_status on;
        allow 127.0.0.1;
        deny all;
    }
}Enable the Nginx integration
Use the Xitoring dashboard or CLI to enable the Nginx integration. Xitogent will auto-detect your Nginx instance.
sudo xitogent integrate nginx --enableConfigure alert thresholds (optional)
Set custom thresholds for metrics like active connections, request rate, or response time to get notified when something needs attention.
Frequently asked questions
Start monitoring Nginx today
Set up in under 60 seconds. No credit card required. Full metrics from day one.
Start Free Trial