Redis Monitoring
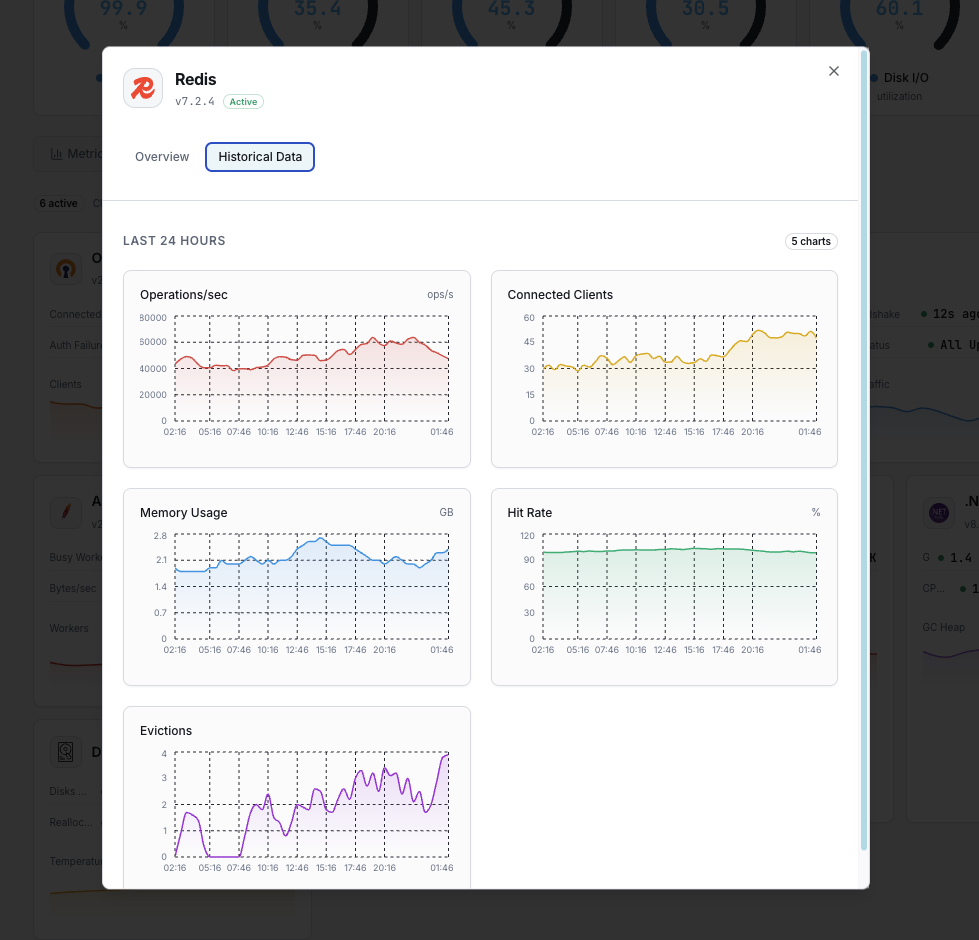
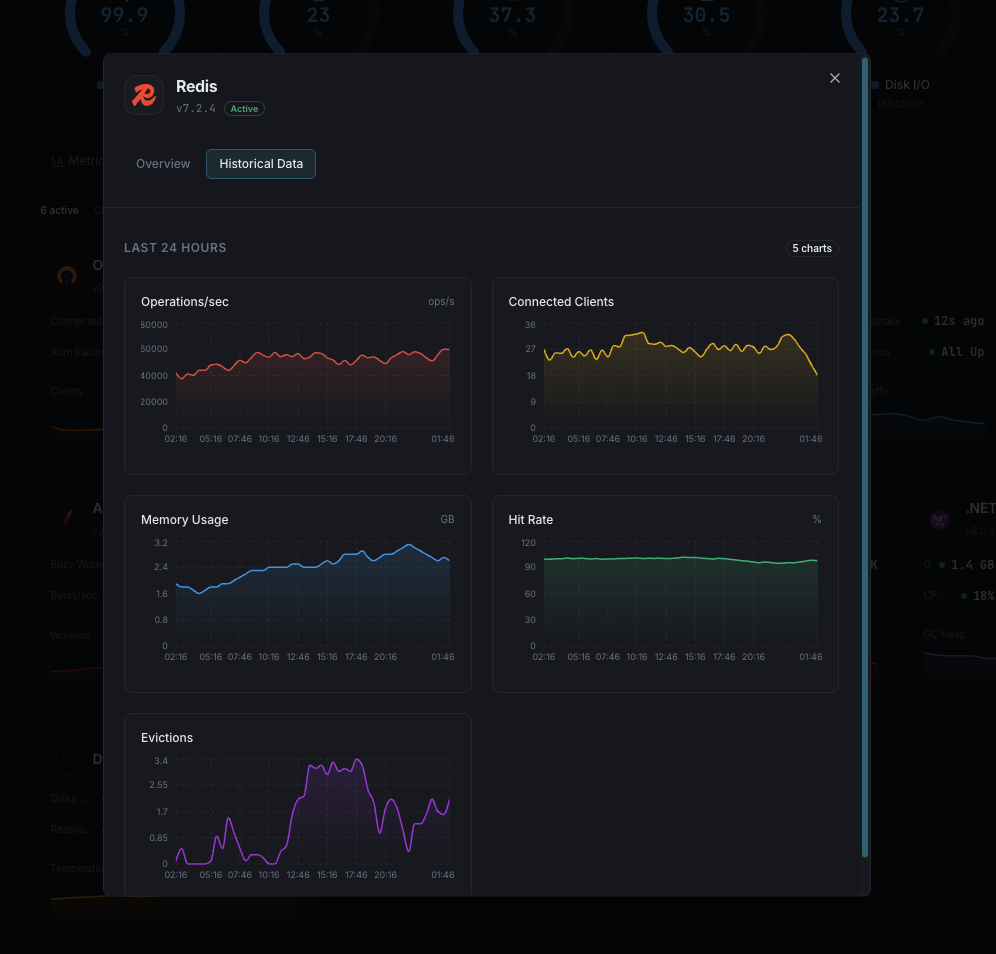
Monitor Redis memory usage, hit rates, connected clients, and replication health in real time with zero configuration.
Why monitor Redis?
Redis is the world's most popular in-memory data store, used as a cache, message broker, and session store by millions of applications. Monitoring Redis is essential to prevent memory overflow, detect cache misses, track eviction rates, and ensure replication consistency. Xitoring's Redis integration provides deep visibility into your Redis instance health.
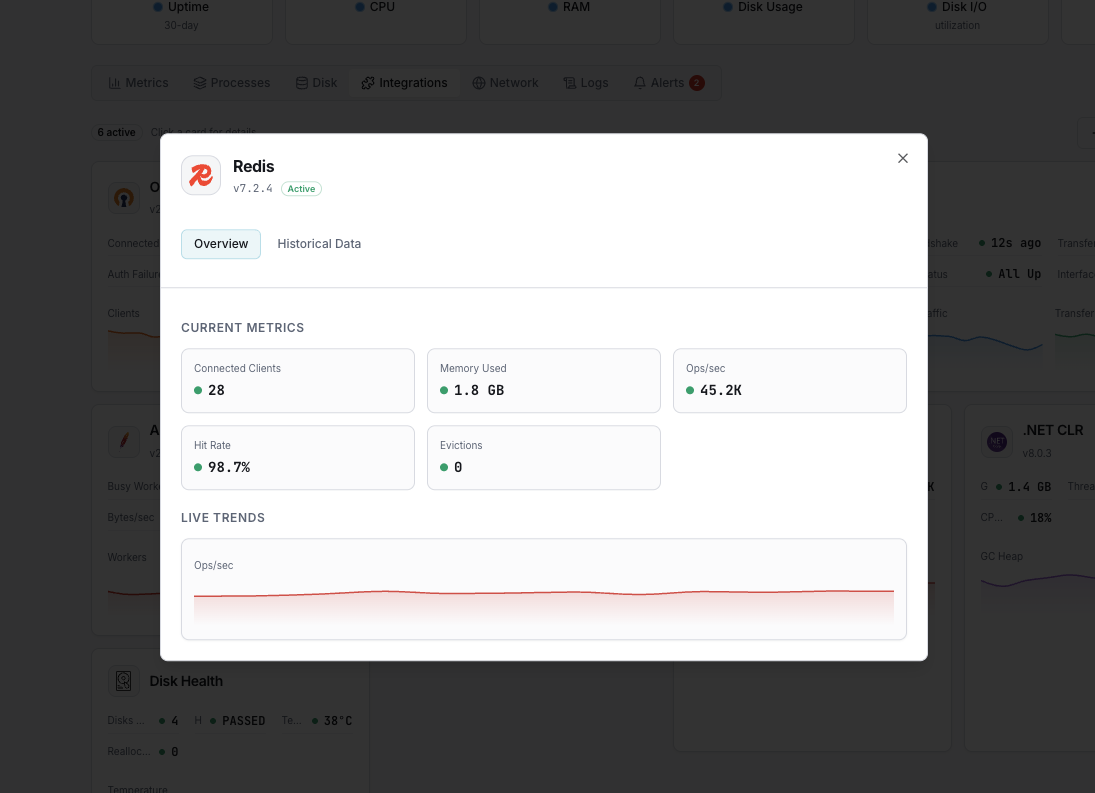
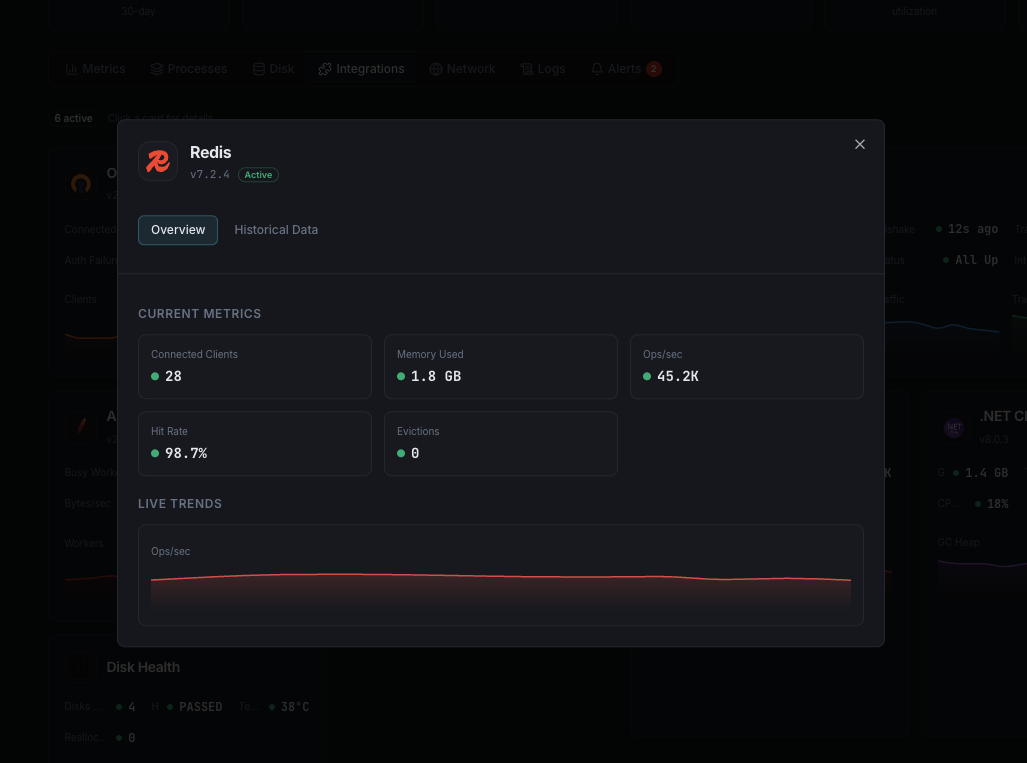
What we monitor
Used Memory
Total memory allocated by Redis including overhead.
Memory Fragmentation Ratio
Ratio of OS-allocated memory to Redis-allocated memory. Values above 1.5 indicate fragmentation.
Connected Clients
Number of currently connected client connections.
Blocked Clients
Number of clients waiting on a blocking call (BLPOP, BRPOP, etc.).
Keyspace Hit Rate
Percentage of successful key lookups vs misses, indicating cache effectiveness.
Evicted Keys
Number of keys removed due to maxmemory policy.
Expired Keys
Number of keys removed due to TTL expiration.
Commands per Second
Rate of commands processed by the Redis server.
Keyspace Size
Total number of keys stored across all databases.
Replication Offset
Replication offset delta between master and replicas.
RDB Last Save
Time since last successful RDB snapshot.
AOF Rewrite
Status and duration of AOF rewrite operations.
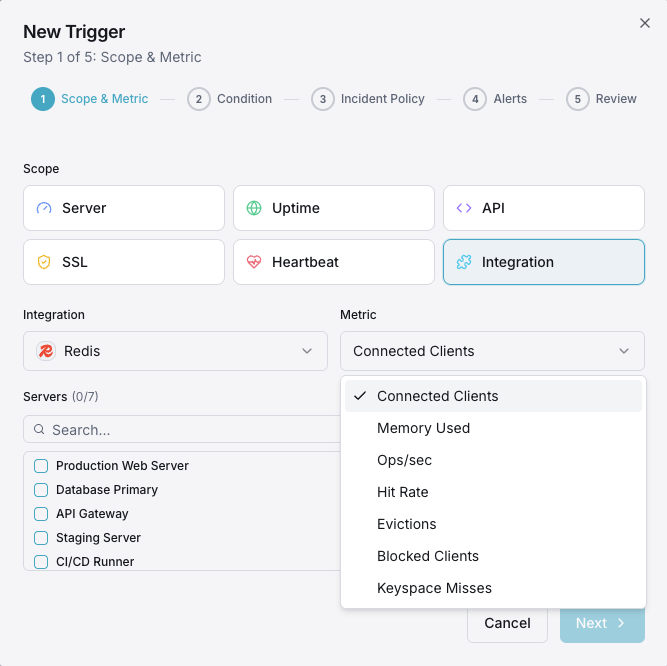
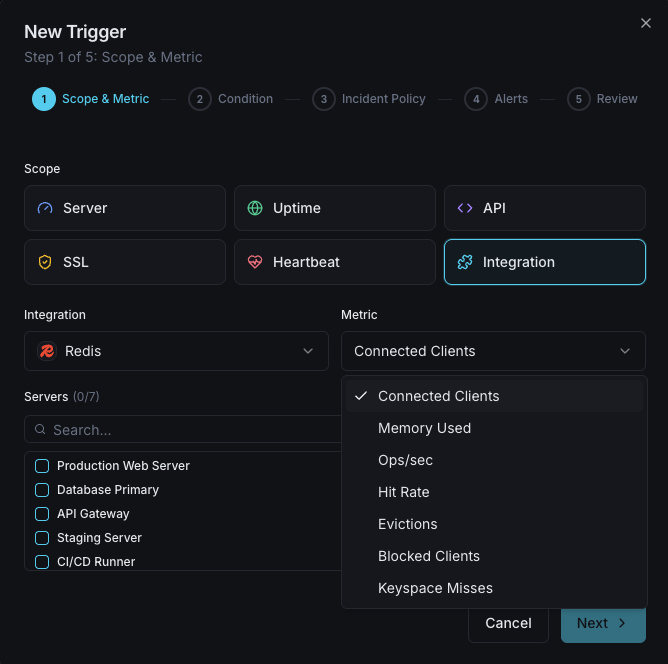
Configurable alert triggers
Set up custom triggers in your dashboard to get notified the moment Redis metrics cross your defined thresholds.
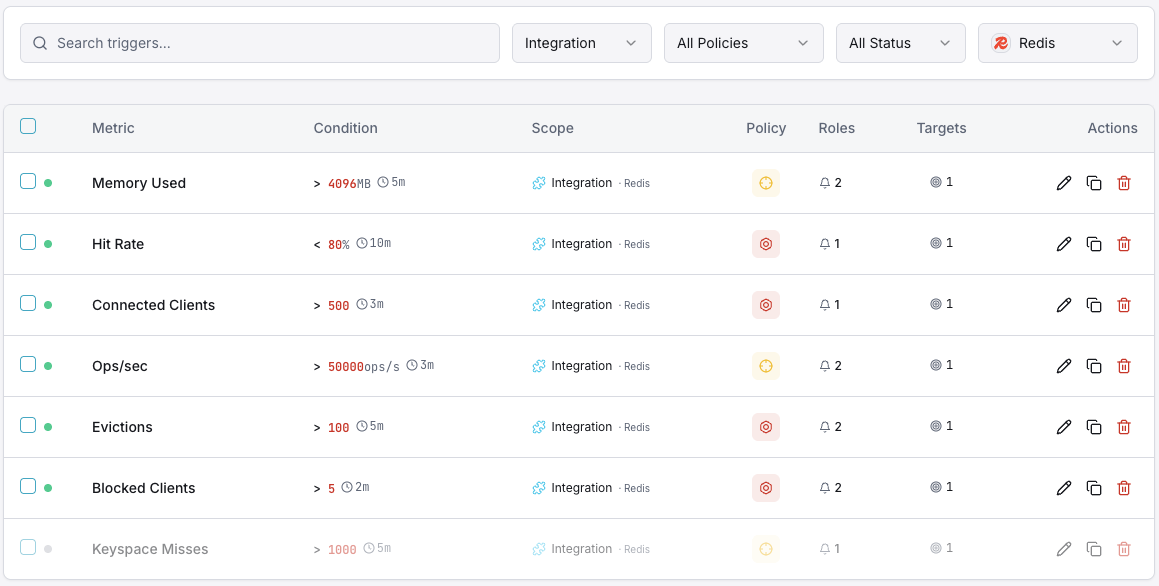
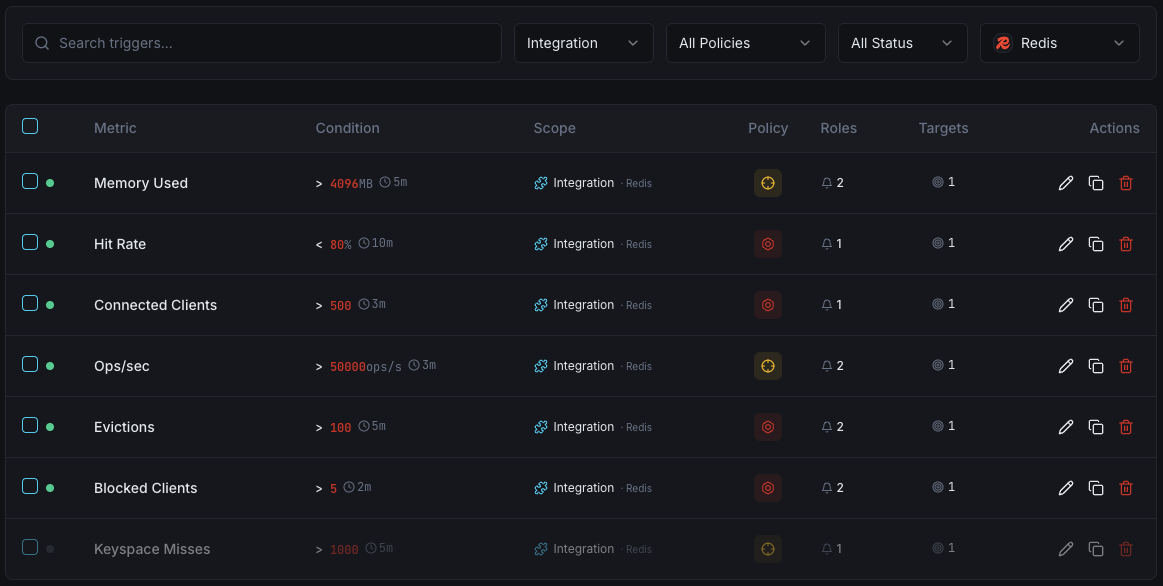
Memory Usage
criticalFires when Redis memory consumption exceeds your threshold, risking OOM kills or eviction storms.
Connected Clients
warningTriggers when client connections exceed the threshold, indicating potential connection leaks.
Keyspace Hit Rate
warningAlerts when cache hit rate drops below threshold, indicating cache inefficiency or working set changes.
Evicted Keys
criticalFires when eviction rate spikes, meaning Redis is actively removing data to stay within memory limits.
Blocked Clients
warningTriggers when clients are blocked waiting on operations, indicating queue congestion.
Replication Lag
criticalAlerts when replica offset falls behind the master, risking data inconsistency in failover scenarios.
Importance of Redis Monitoring
Redis serves as the performance backbone for modern applications — handling sessions, caching, rate limiting, and real-time analytics. Without monitoring, memory pressure, eviction storms, and replication drift can silently degrade your entire application stack.
- Detect memory pressure before OOM kills crash your instance
- Monitor cache hit rates to ensure optimal application performance
- Track eviction patterns to right-size your memory allocation
- Identify connection leaks from application clients
- Ensure replication consistency for high-availability setups
Why Choose Xitoring
Xitoring delivers enterprise-grade Redis monitoring with zero-config setup. Our lightweight agent auto-discovers your Redis instances, starts collecting metrics in under 60 seconds, and integrates with your existing notification channels.
- One-command install — no complex YAML or config files
- 50+ global monitoring nodes for low-latency checks
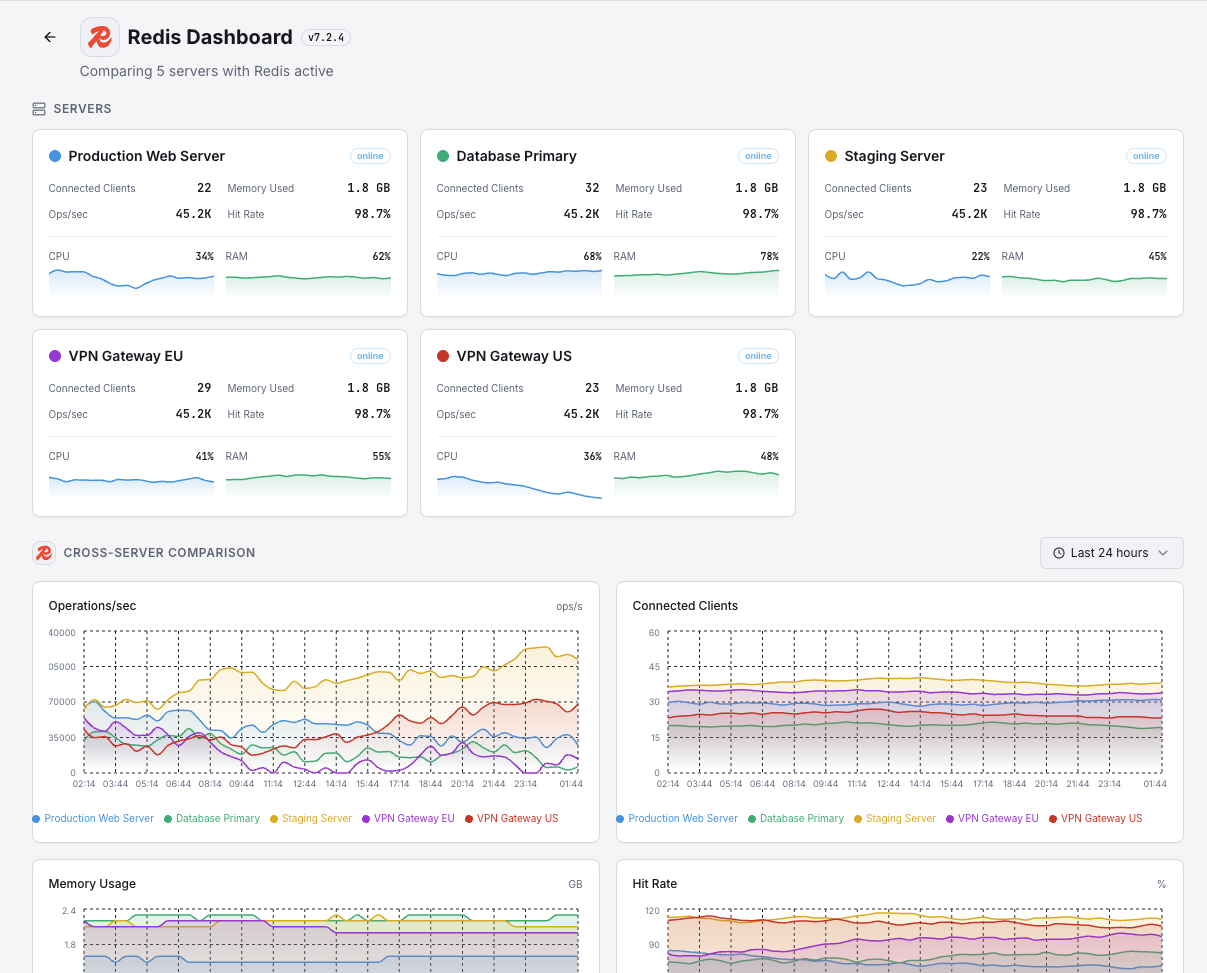
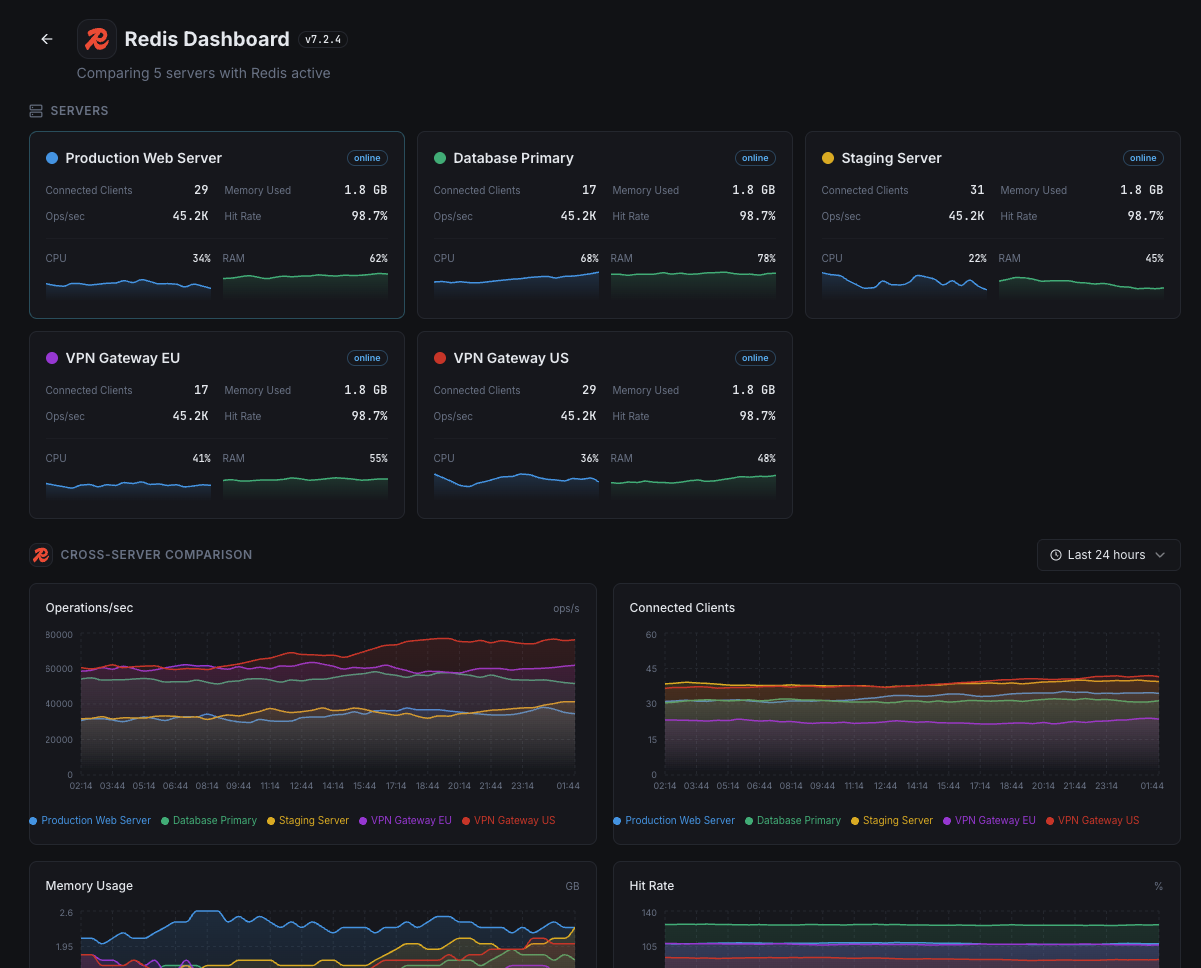
- Unified dashboard for servers, caches, and uptime
- Flexible alerting via Slack, PagerDuty, Telegram & more
- Historical data retention for capacity planning & audits
Get started in minutes
Install Xitogent on your server
If you haven't already, install the lightweight Xitogent monitoring agent on your server.
curl -s https://xitoring.com/install.sh | sudo bashEnsure Redis INFO command is accessible
Xitogent uses the Redis INFO command to collect metrics. Make sure your Redis instance allows local connections:
redis-cli INFO server | head -5Enable the Redis integration
Use the Xitoring dashboard or CLI to enable the Redis integration. Xitogent will auto-detect your Redis instance.
sudo xitogent integrate redis --enableConfigure alert thresholds (optional)
Set custom thresholds for metrics like memory usage, hit rate, or eviction count to get notified when something needs attention.
Frequently asked questions
Start monitoring Redis today
Set up in under 60 seconds. No credit card required. Full metrics from day one.
Start Free TrialKeep exploring