Varnish Monitoring
Monitor Varnish Cache hit rates, backend health, object storage, and request throughput in real time with zero configuration.
Why monitor Varnish?
Varnish Cache is a powerful HTTP accelerator used to dramatically speed up web applications. Monitoring Varnish is critical to ensure high cache hit ratios, detect backend failures, track object evictions, and maintain optimal performance for your content delivery.
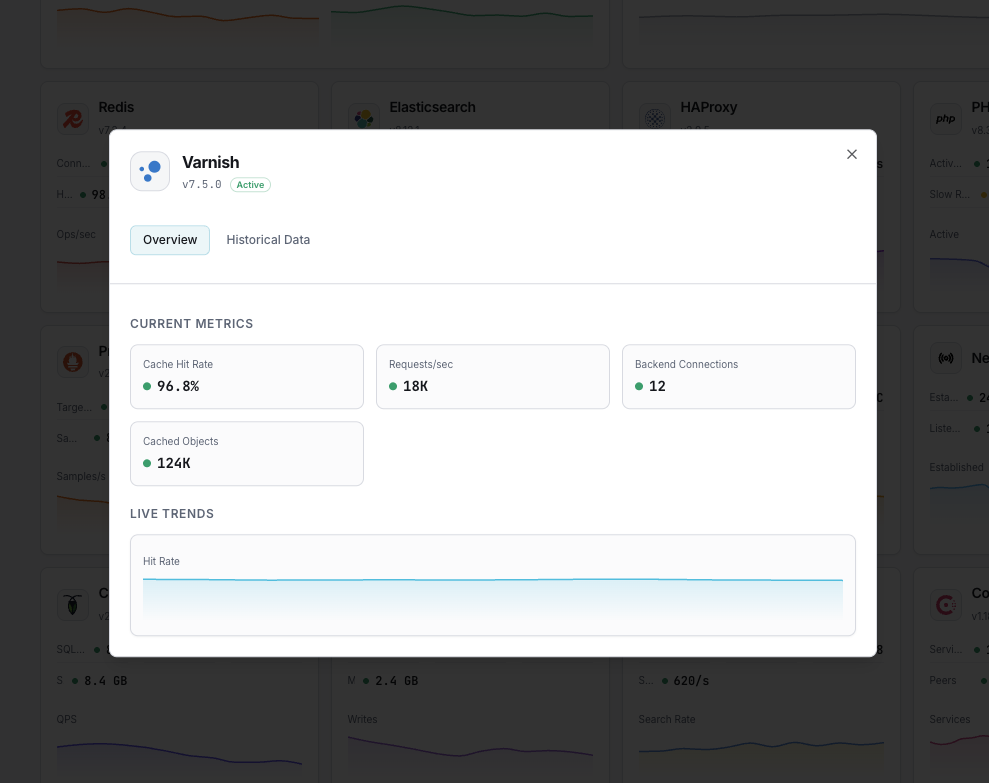
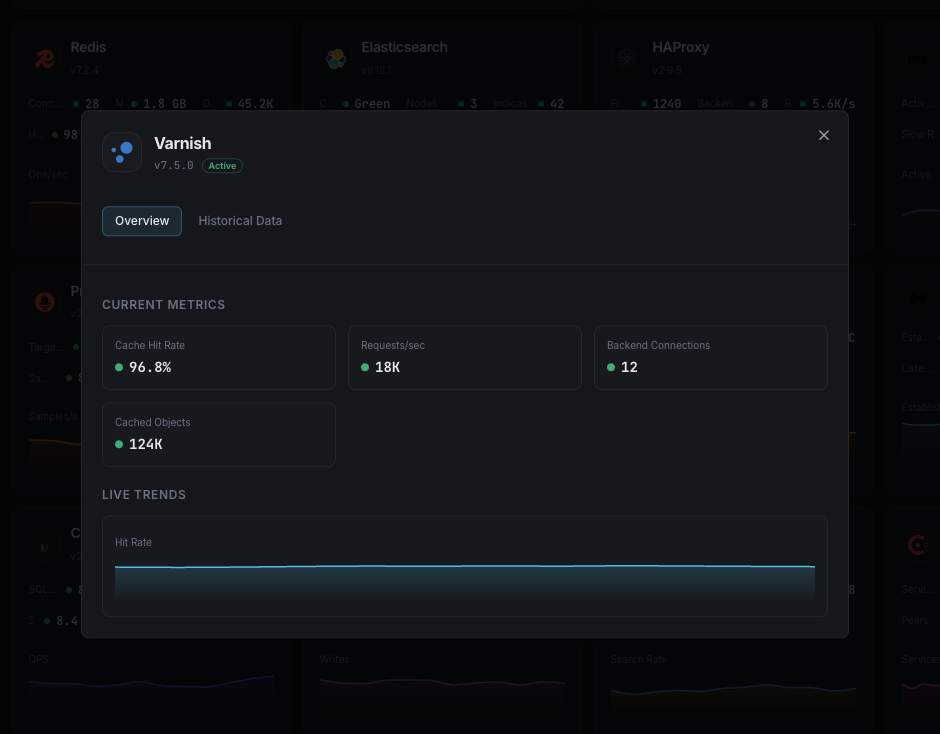
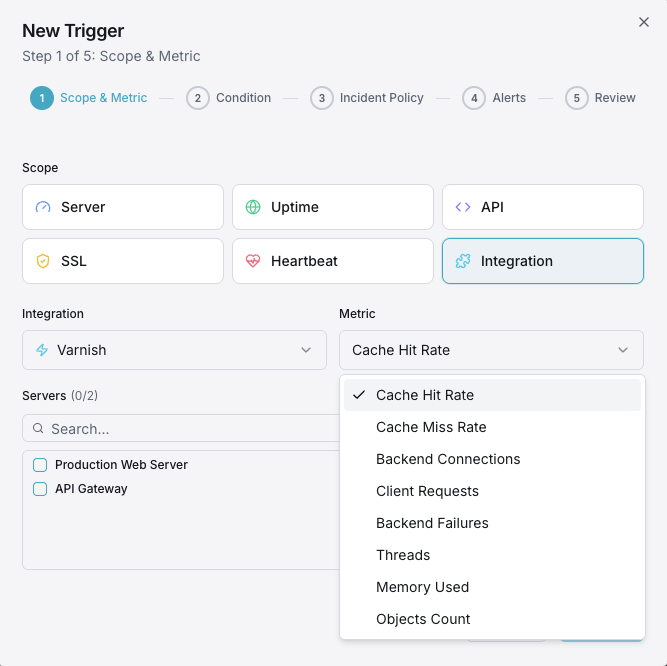
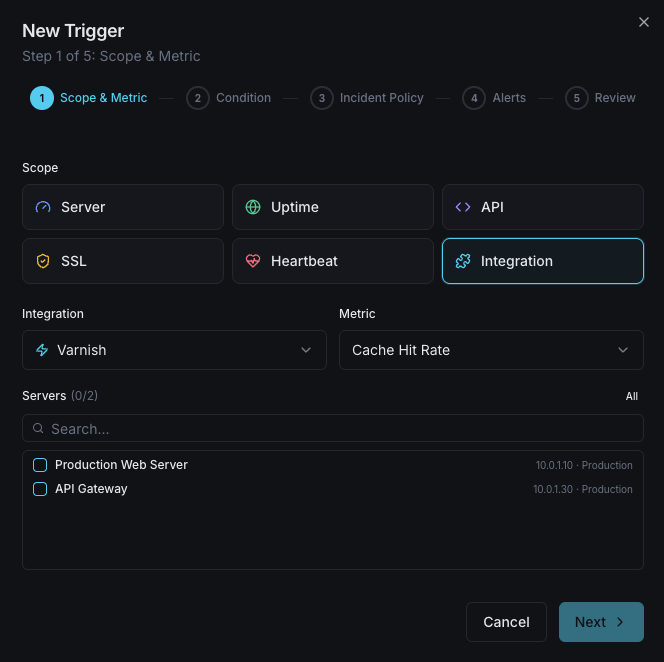
What we monitor
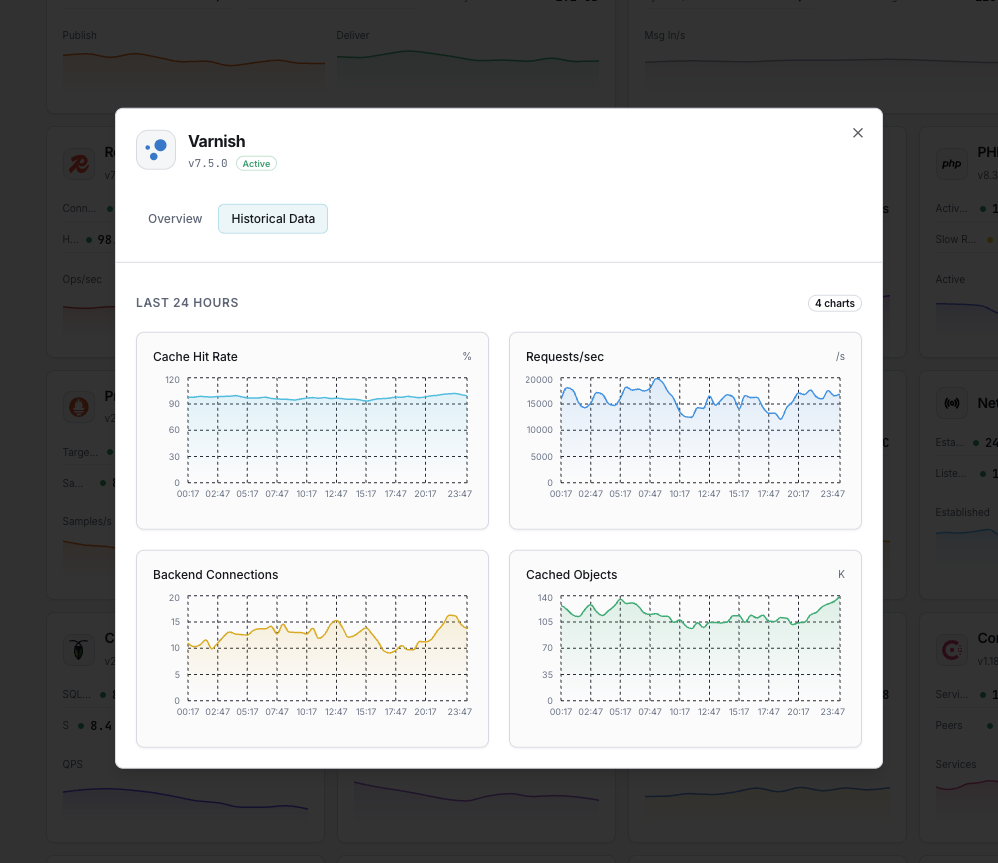
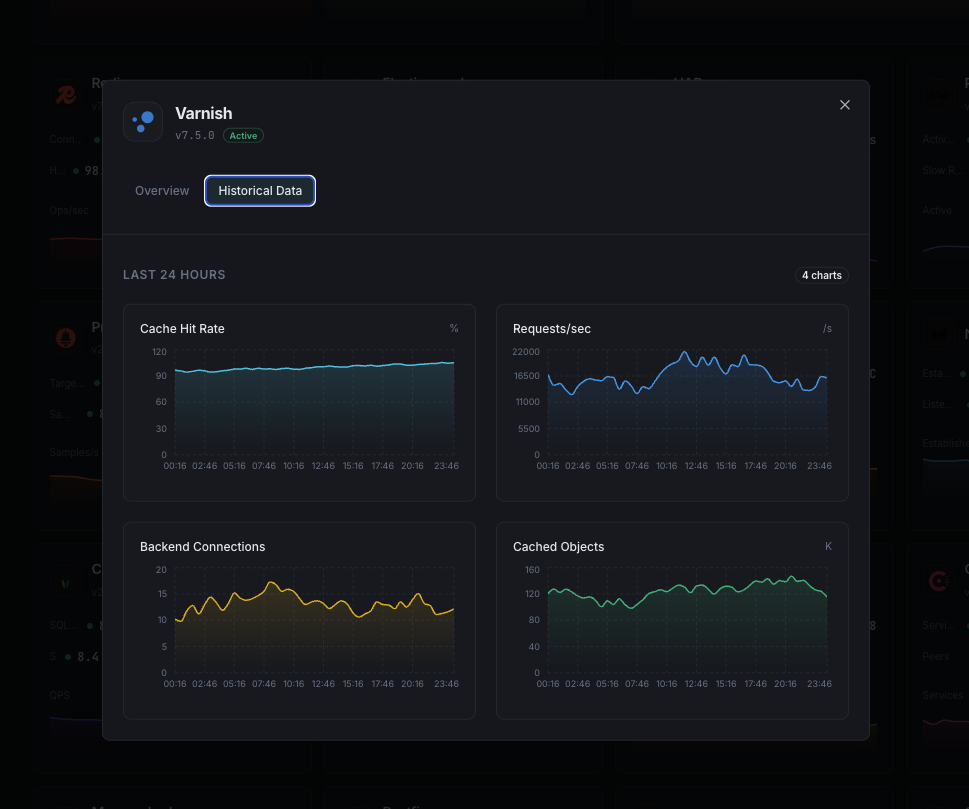
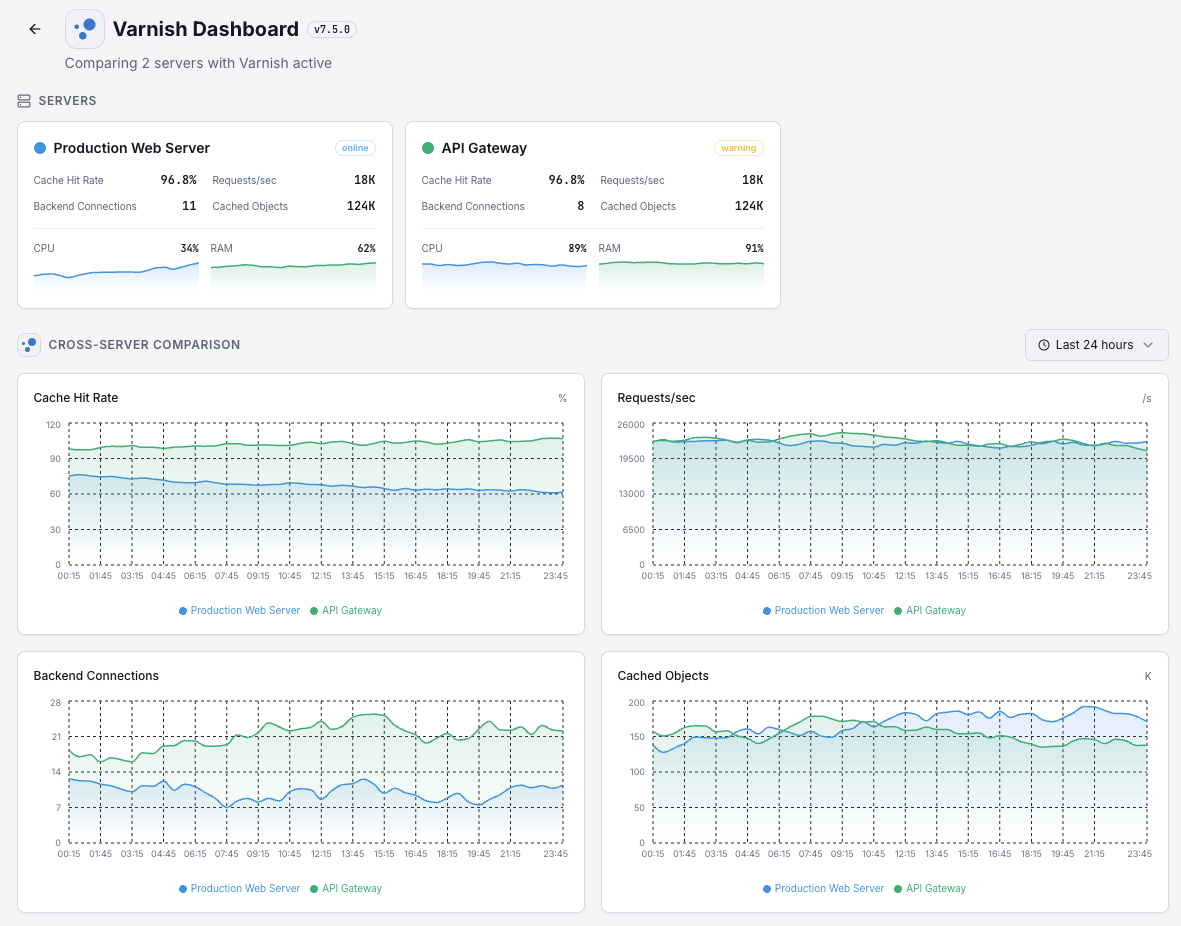
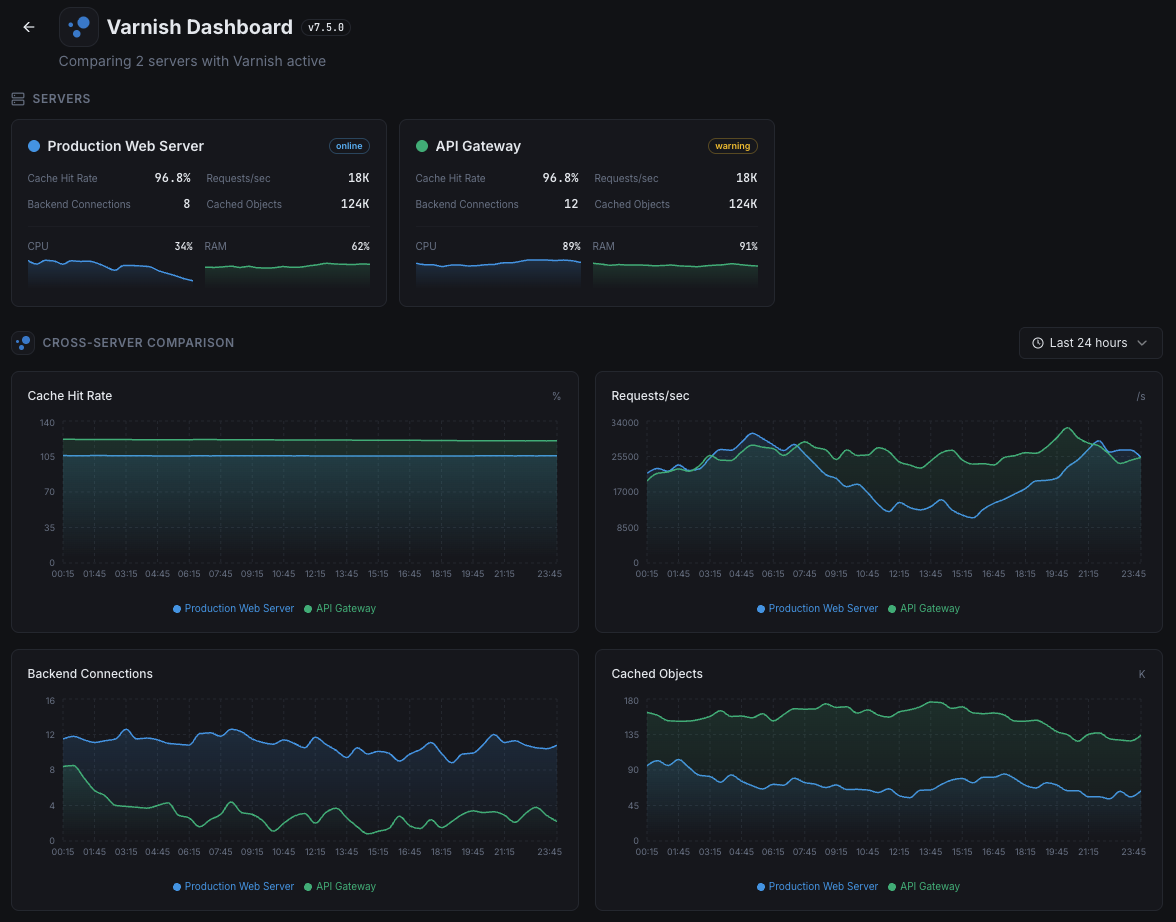
Cache Hit Ratio
Percentage of requests served from cache.
Backend Health
Health status of origin servers.
Object Evictions
Rate of objects evicted from cache.
Requests/sec
Total request throughput.
Thread Pool Usage
Active threads vs available.
Backend Connections
Connections to origin servers.
Cache Size
Current cached object storage usage.
Ban List Length
Number of active cache bans.
Configurable alert triggers
Set up custom triggers in your dashboard to get notified the moment Varnish metrics cross your defined thresholds.
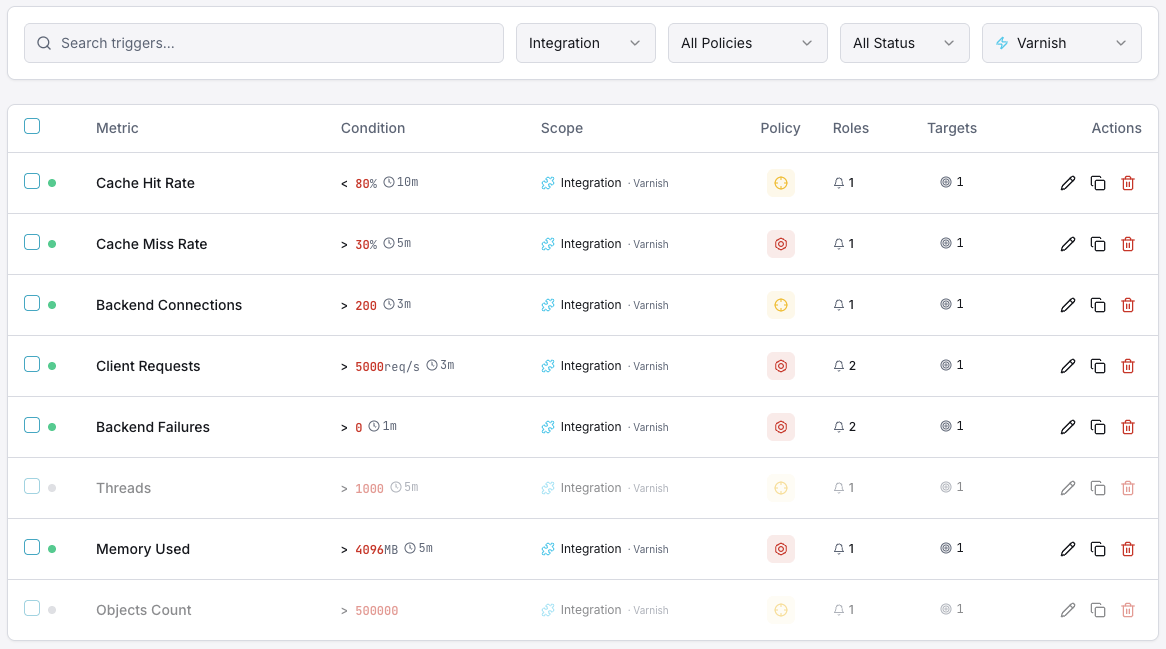
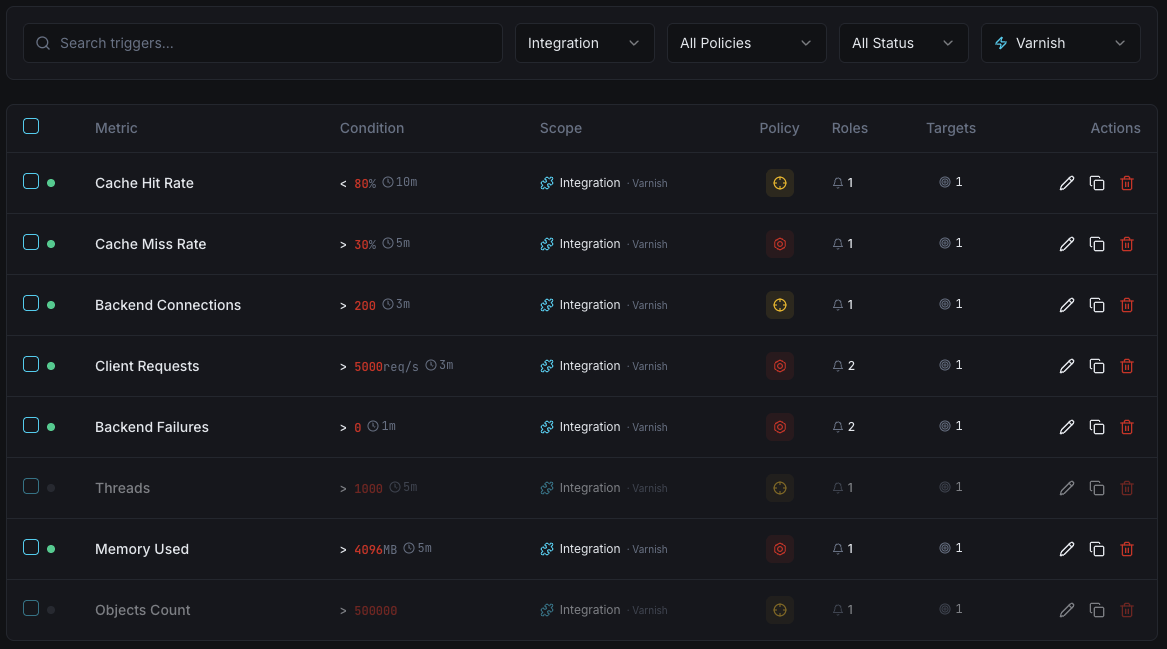
Cache Hit Ratio
warningFires when hit ratio drops below threshold.
Backend Down
criticalAlerts when a backend server fails health checks.
Object Evictions
warningTriggers on high eviction rate indicating cache pressure.
Thread Pool
criticalFires when thread pool is exhausted.
Request Rate
warningAlerts on unusual request throughput.
Importance of Varnish Monitoring
Varnish Cache can serve content 300x faster than origin servers. Without monitoring, cache misses and backend failures negate these benefits.
- Maintain high cache hit ratios for optimal speed
- Detect backend failures immediately
- Track evictions to right-size cache storage
- Monitor thread pools to prevent request drops
Why Choose Xitoring
Enterprise-grade Varnish monitoring with zero-config setup.
- One-command install
- 50+ global monitoring nodes
- Unified dashboard
- Multi-channel alerting
- Historical data retention
Get started in minutes
Install Xitogent
Install the monitoring agent.
curl -s https://xitoring.com/install.sh | sudo bashEnable Varnish integration
Enable via CLI.
sudo xitogent integrate varnish --enableConfigure alerts (optional)
Set thresholds for cache hit ratio, evictions, or backend health.
Frequently asked questions
Start monitoring Varnish today
Set up in under 60 seconds. No credit card required. Full metrics from day one.
Start Free Trial