PostgreSQL Monitoring
Monitor PostgreSQL transactions, connections, replication, and vacuum performance in real time with zero configuration.
Why monitor PostgreSQL?
PostgreSQL is the world's most advanced open-source relational database, trusted for critical workloads from financial systems to geospatial applications. Monitoring PostgreSQL is essential to detect long-running queries, prevent connection saturation, track replication health, and optimize vacuum operations. Xitoring's PostgreSQL integration delivers comprehensive database observability.
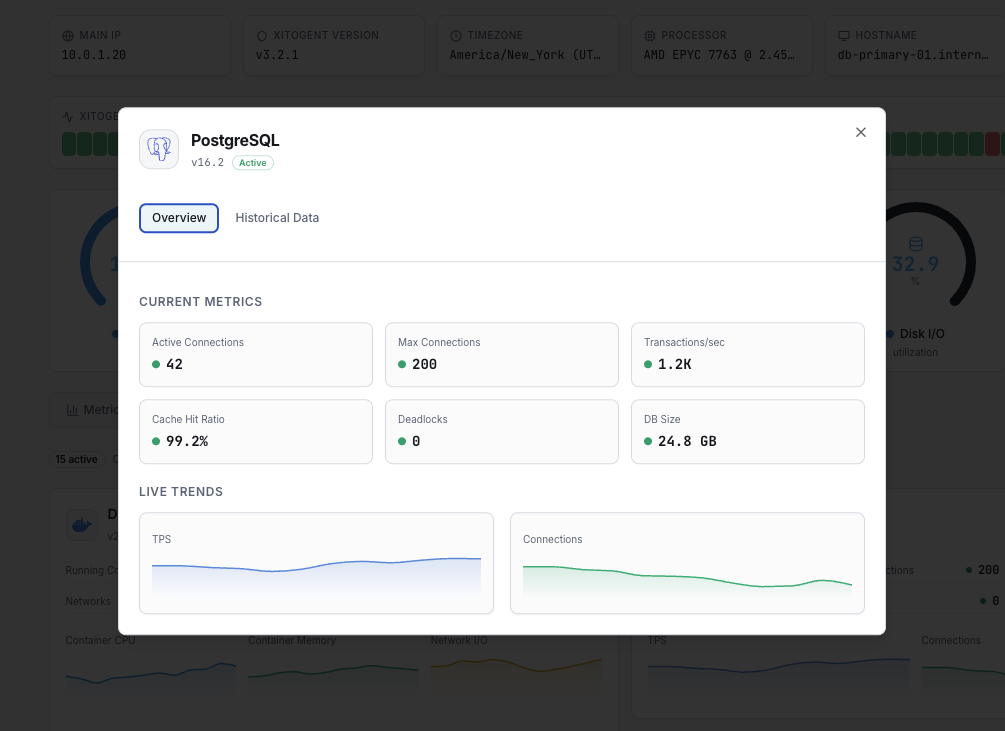
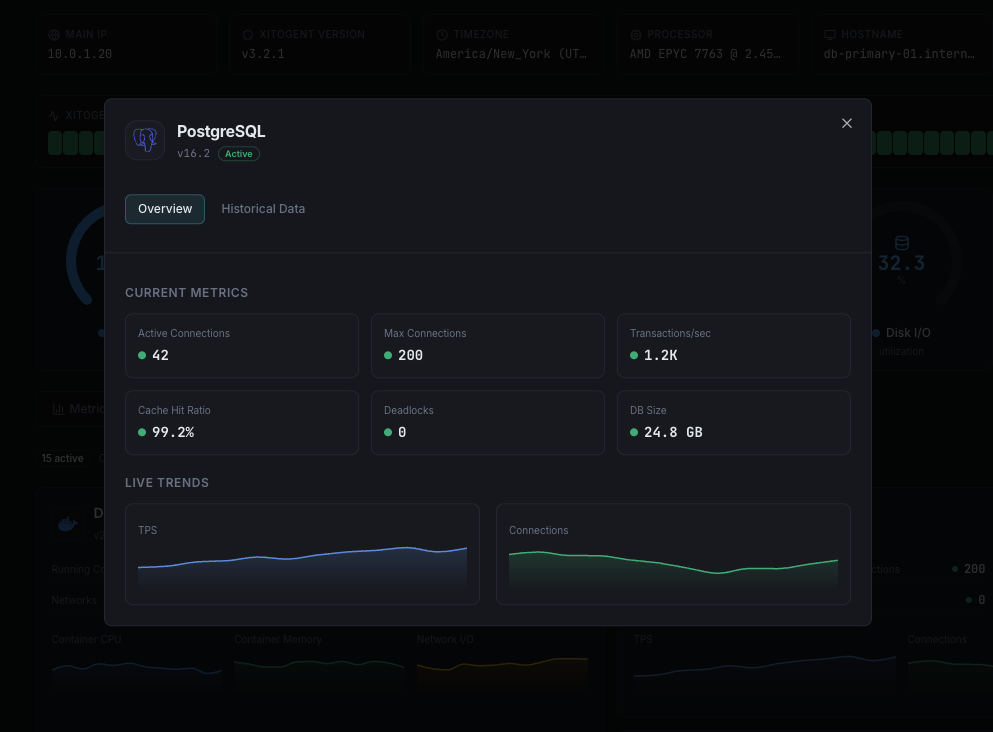
What we monitor
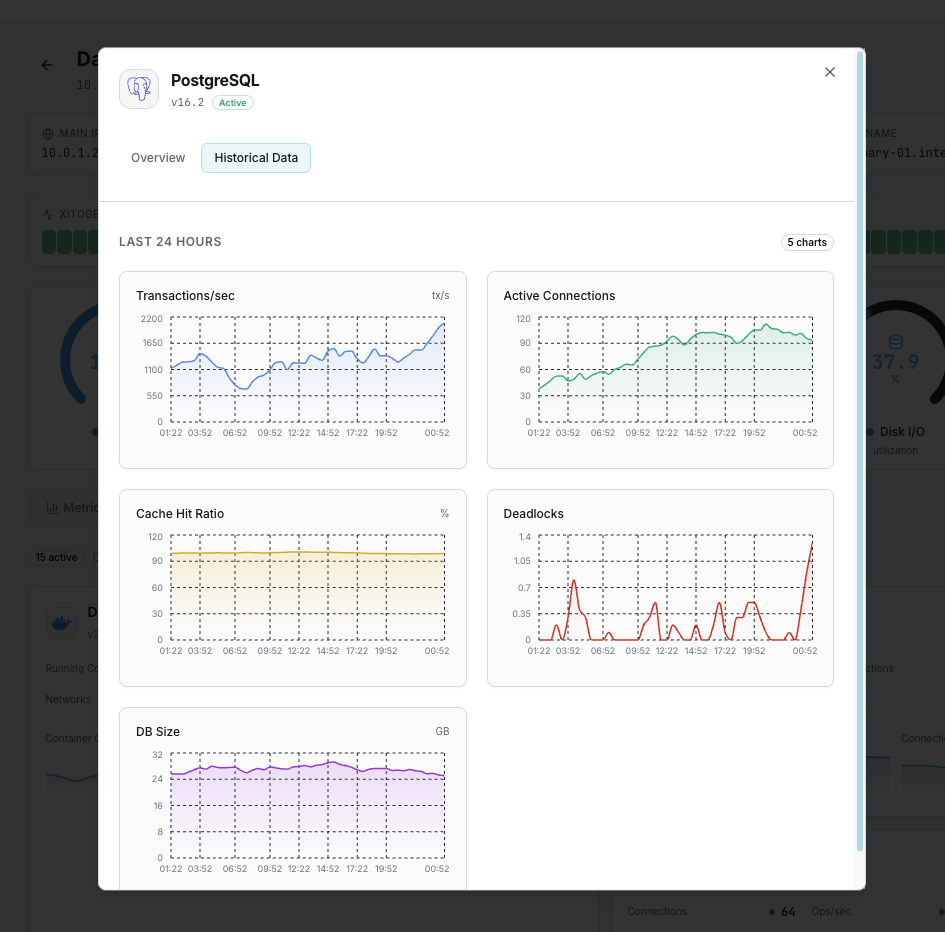
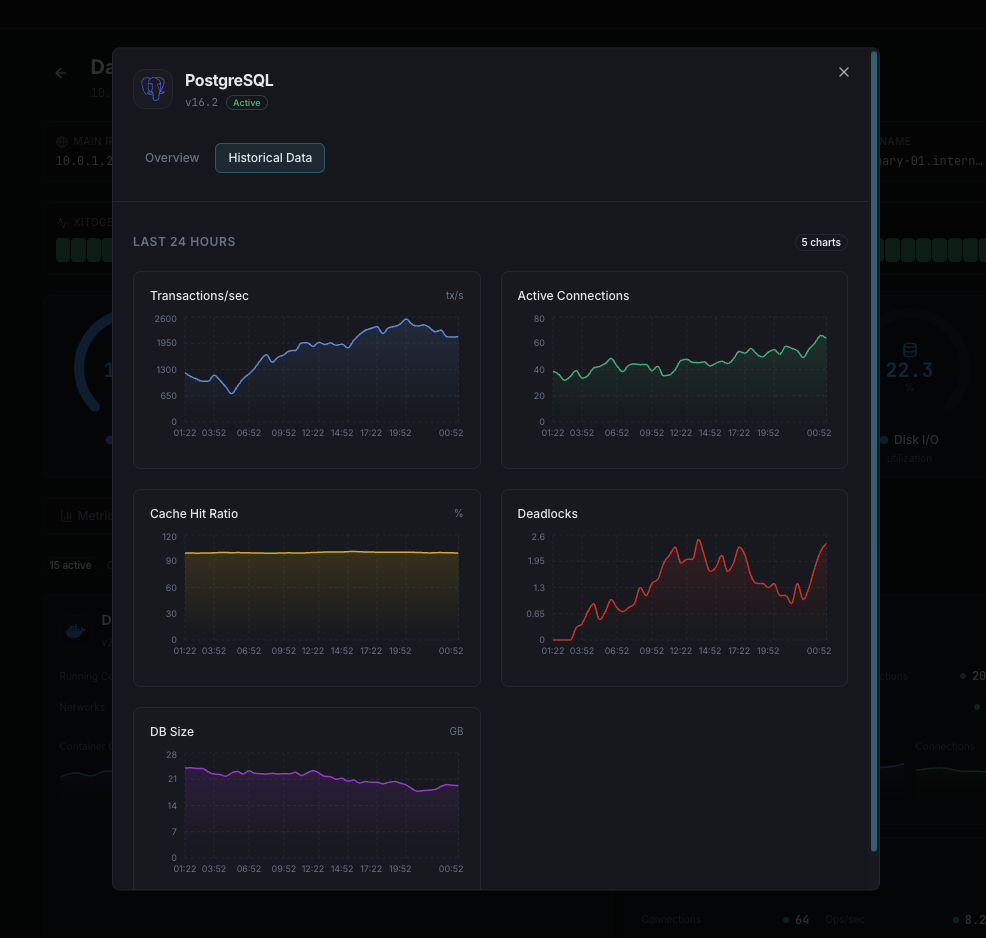
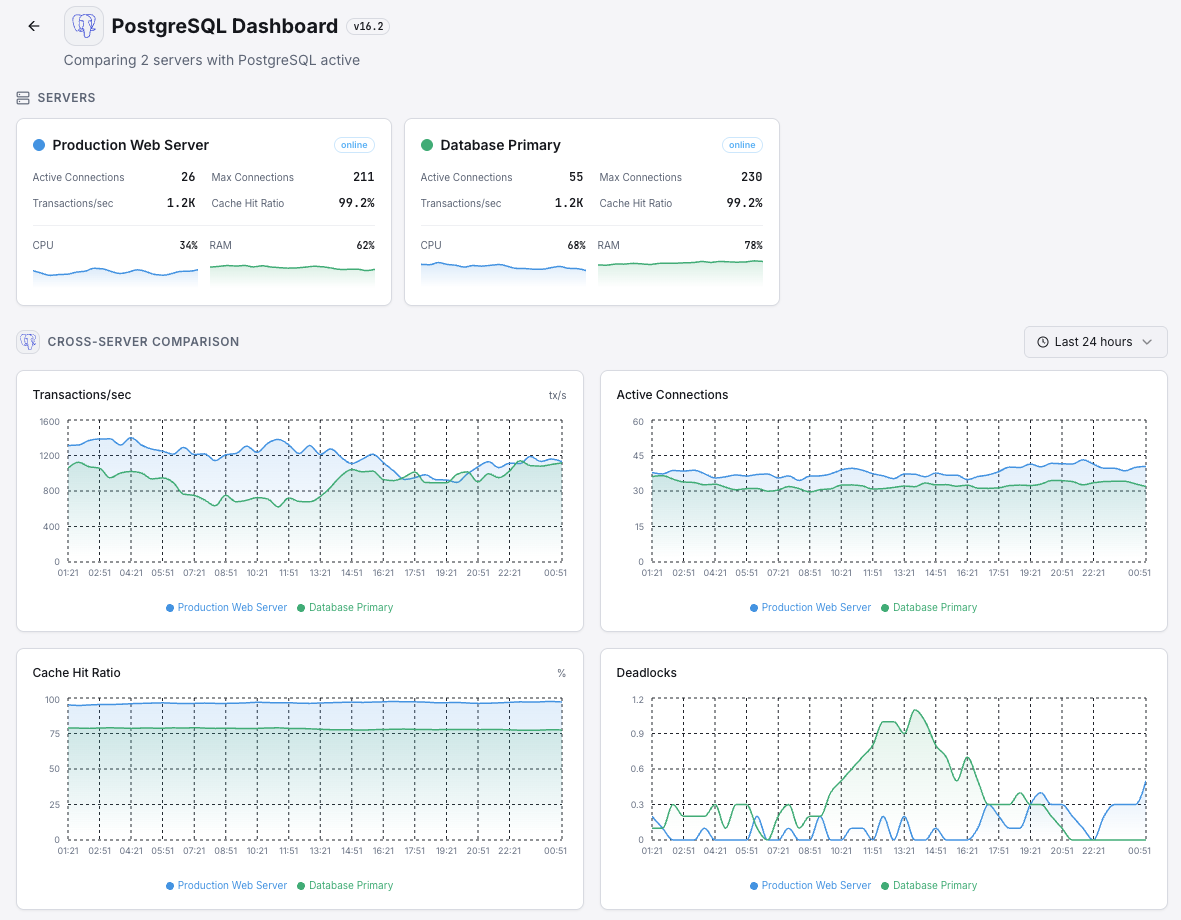
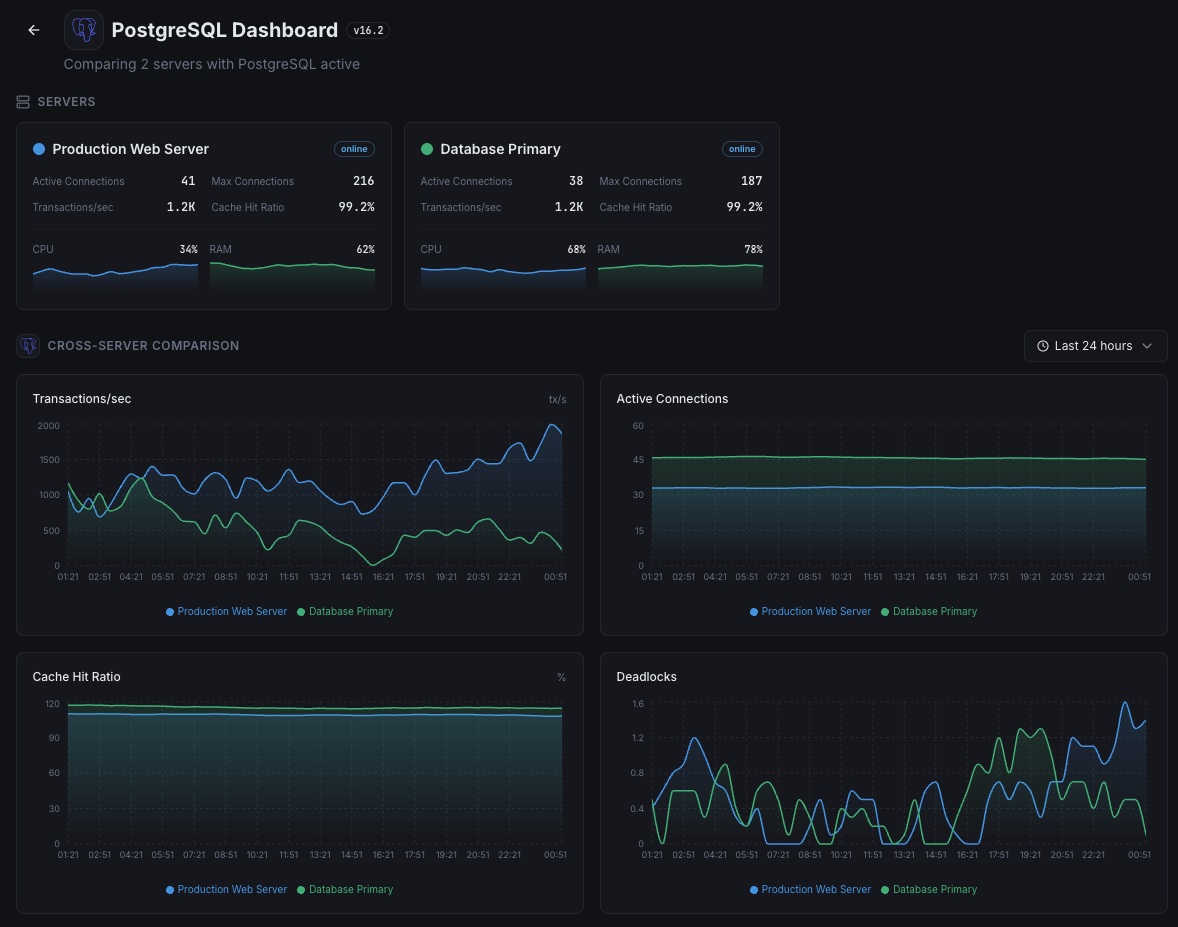
Active Connections
Number of currently active connections to the PostgreSQL server.
Transactions per Second
Rate of committed and rolled-back transactions.
Tuple Operations
Rate of inserted, updated, deleted, and fetched tuples across all databases.
Dead Tuples
Number of dead tuples waiting for vacuum, indicating potential table bloat.
Cache Hit Ratio
Percentage of data requests served from shared buffers without disk access.
Replication Lag
Bytes or seconds behind the primary in streaming replication.
WAL Generation Rate
Rate of Write-Ahead Log data being generated.
Lock Waits
Number of queries waiting to acquire locks on database objects.
Temp Files Created
Number and size of temporary files created for query processing.
Database Size
Total disk space used by each database including indexes.
Idle in Transaction
Connections that are idle inside an open transaction, potentially holding locks.
Checkpoints
Frequency and duration of checkpoint operations.
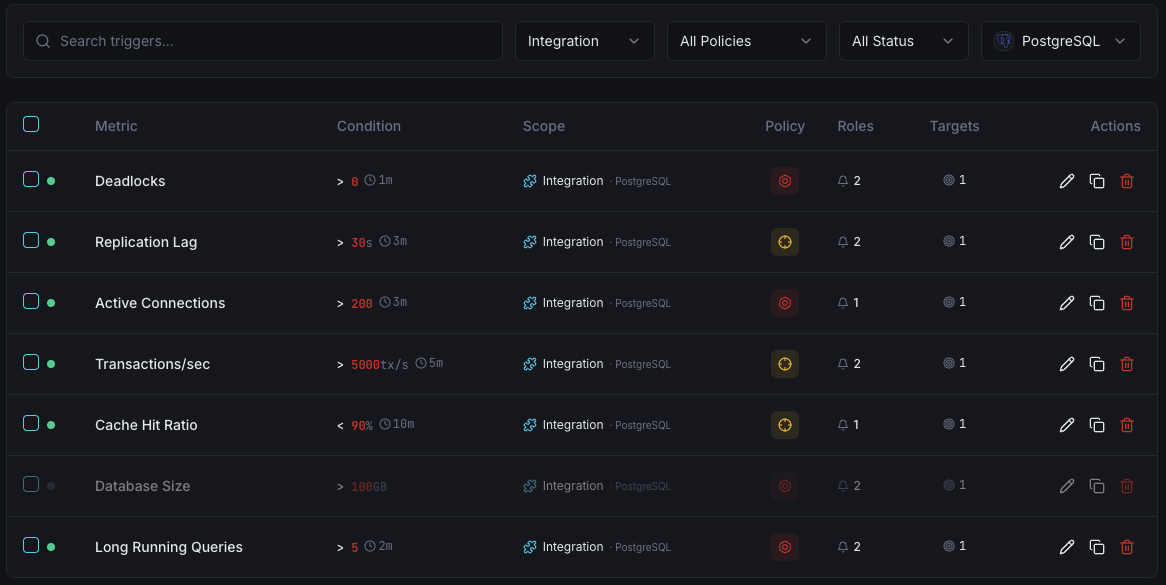
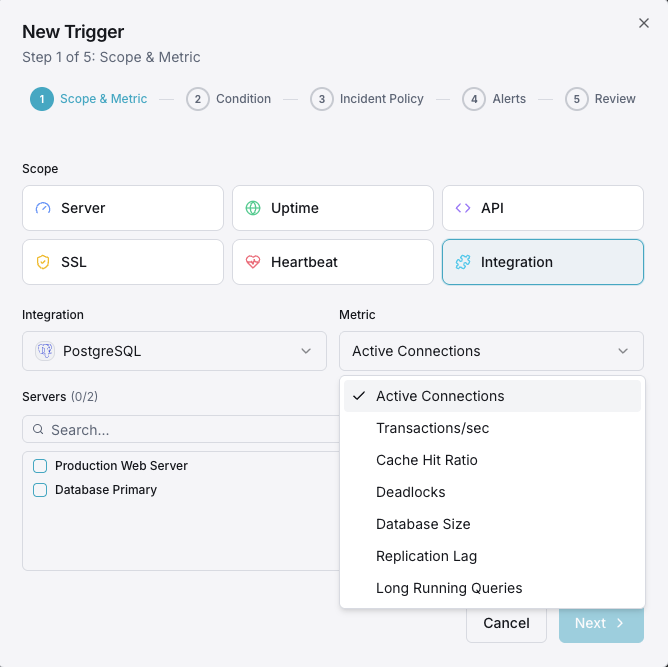
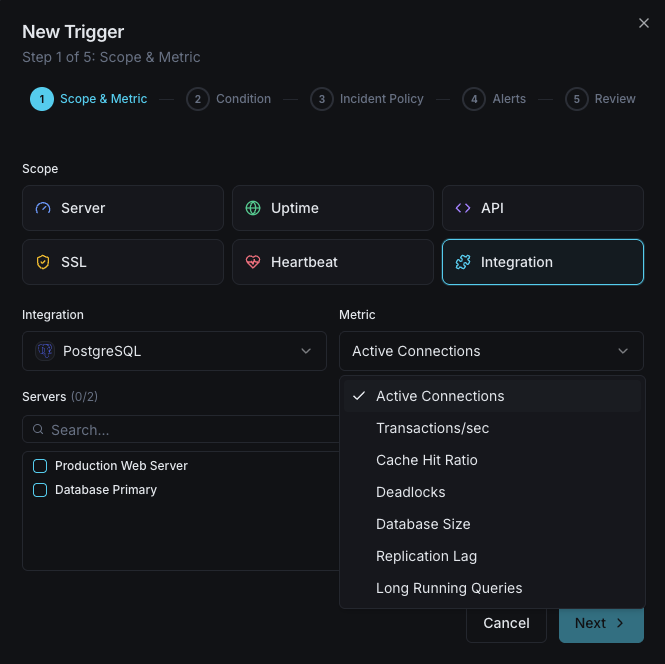
Configurable alert triggers
Set up custom triggers in your dashboard to get notified the moment PostgreSQL metrics cross your defined thresholds.
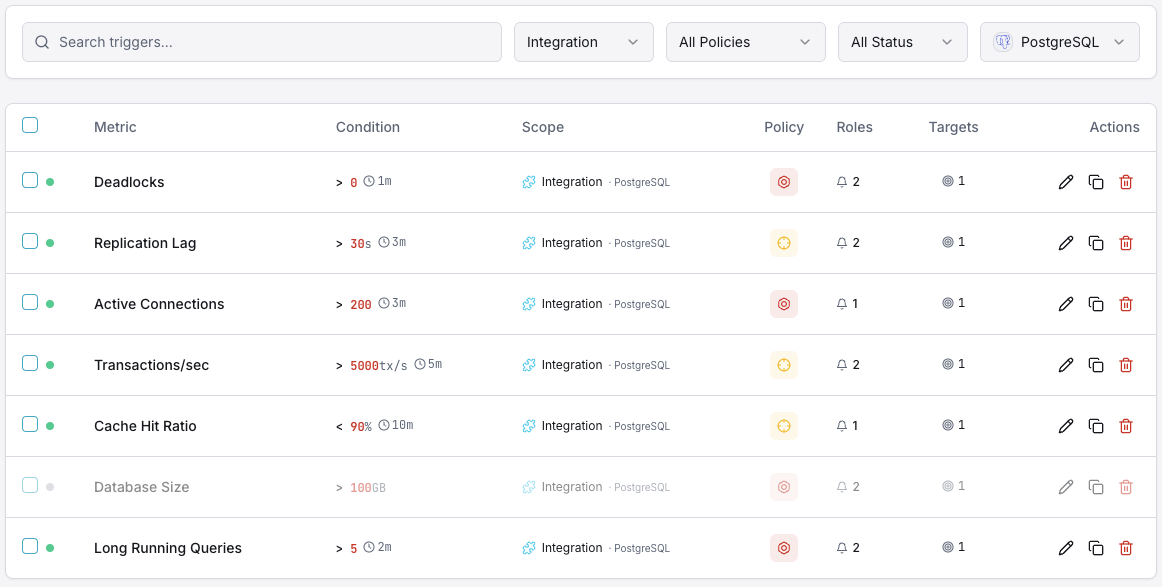
Active Connections
criticalFires when active connections approach max_connections, risking new connection refusal and application errors.
Replication Lag
criticalTriggers when streaming replication falls behind, risking data inconsistency between primary and replicas.
Dead Tuples
warningAlerts when dead tuple count grows beyond threshold, indicating vacuum is falling behind and table bloat is increasing.
Cache Hit Ratio
warningFires when cache hit ratio drops below threshold, indicating excessive disk I/O and potential memory pressure.
Lock Waits
warningTriggers when queries are blocked waiting for locks, indicating contention that degrades performance.
Transaction Rate Drop
criticalAlerts when transaction throughput drops significantly, indicating a potential database hang or performance issue.
Importance of PostgreSQL Monitoring
PostgreSQL handles mission-critical data for enterprises worldwide. Without proper monitoring, table bloat, replication drift, and connection exhaustion can lead to data corruption, outages, and unrecoverable failures.
- Detect long-running queries and lock contention early
- Prevent table bloat with vacuum performance tracking
- Monitor streaming replication for data consistency
- Identify connection leaks before pool exhaustion
- Track WAL generation for storage capacity planning
Why Choose Xitoring
Xitoring delivers enterprise-grade PostgreSQL monitoring with zero-config setup. Our lightweight agent auto-discovers your PostgreSQL instances, starts collecting metrics in under 60 seconds, and integrates with your existing notification channels.
- One-command install — no complex YAML or config files
- 50+ global monitoring nodes for low-latency checks
- Unified dashboard for servers, databases, and uptime
- Flexible alerting via Slack, PagerDuty, Telegram & more
- Historical data retention for capacity planning & audits
Get started in minutes
Install Xitogent on your server
If you haven't already, install the lightweight Xitogent monitoring agent on your server.
curl -s https://xitoring.com/install.sh | sudo bashCreate a monitoring user in PostgreSQL
Create a dedicated read-only user for Xitogent to collect metrics:
CREATE USER xitoring WITH PASSWORD 'your_secure_password';
GRANT pg_monitor TO xitoring;Enable the PostgreSQL integration
Use the Xitoring dashboard or CLI to enable the PostgreSQL integration with the monitoring credentials.
sudo xitogent integrate postgresql --enableConfigure alert thresholds (optional)
Set custom thresholds for metrics like replication lag, dead tuples, or connection count to get notified when something needs attention.
Frequently asked questions
Start monitoring PostgreSQL today
Set up in under 60 seconds. No credit card required. Full metrics from day one.
Start Free Trial