Memcached Monitoring
Monitor Memcached connections, hit rates, memory usage, and eviction metrics in real time with zero configuration.
Why monitor Memcached?
Memcached is a high-performance, distributed memory caching system used to speed up dynamic web applications by reducing database load. Monitoring Memcached ensures optimal cache utilization, detects eviction storms, and prevents memory exhaustion across your caching layer.
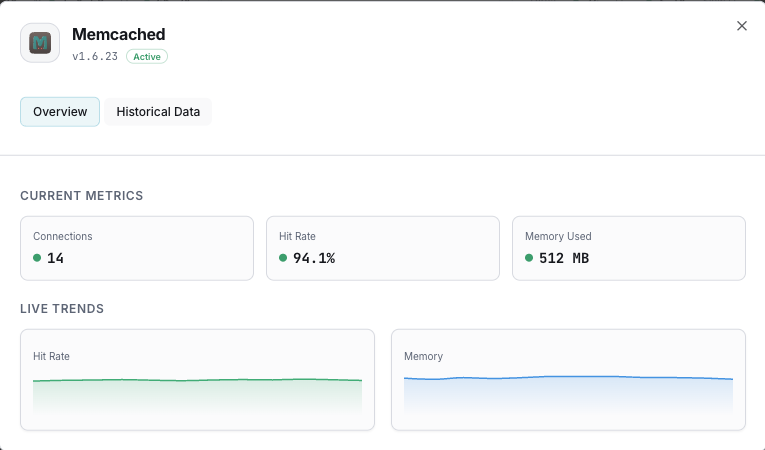
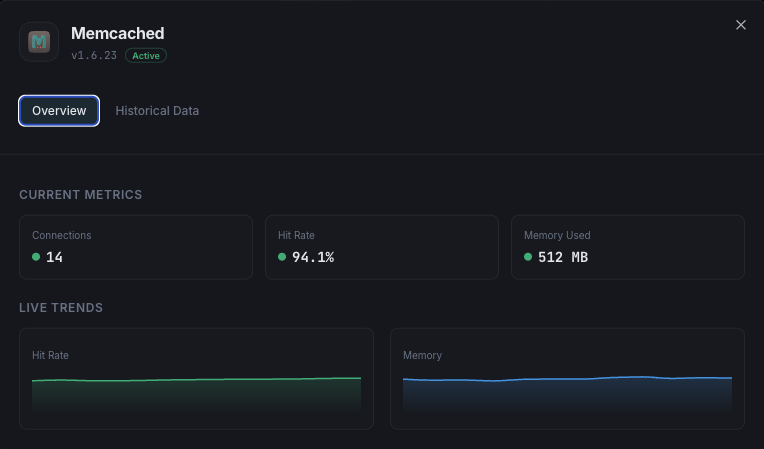
What we monitor
Used Memory
Total memory currently allocated for cached items.
Max Memory
Maximum memory limit configured for the Memcached instance.
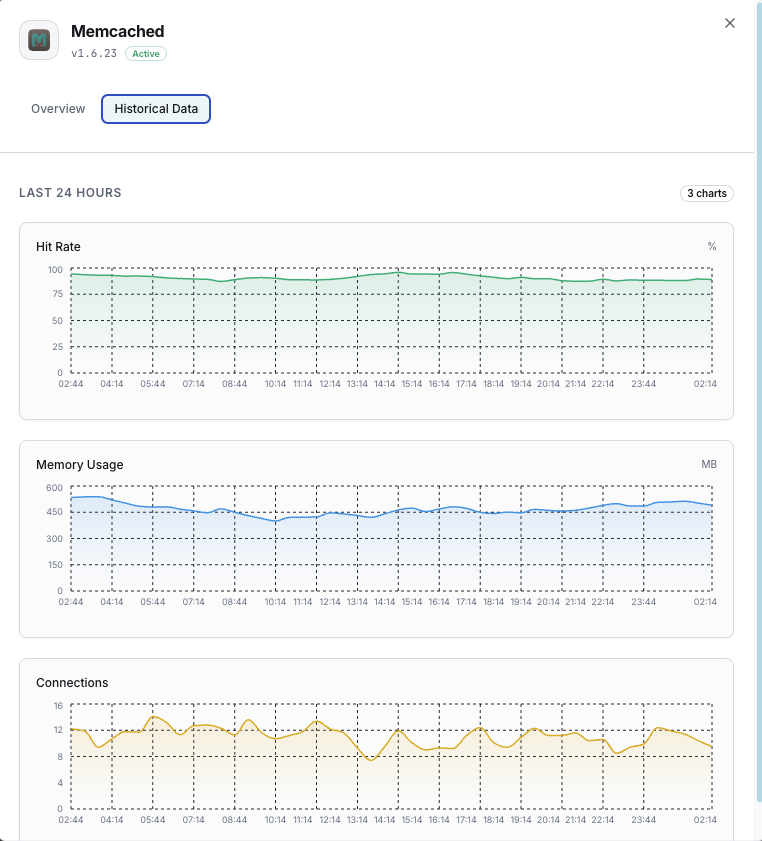
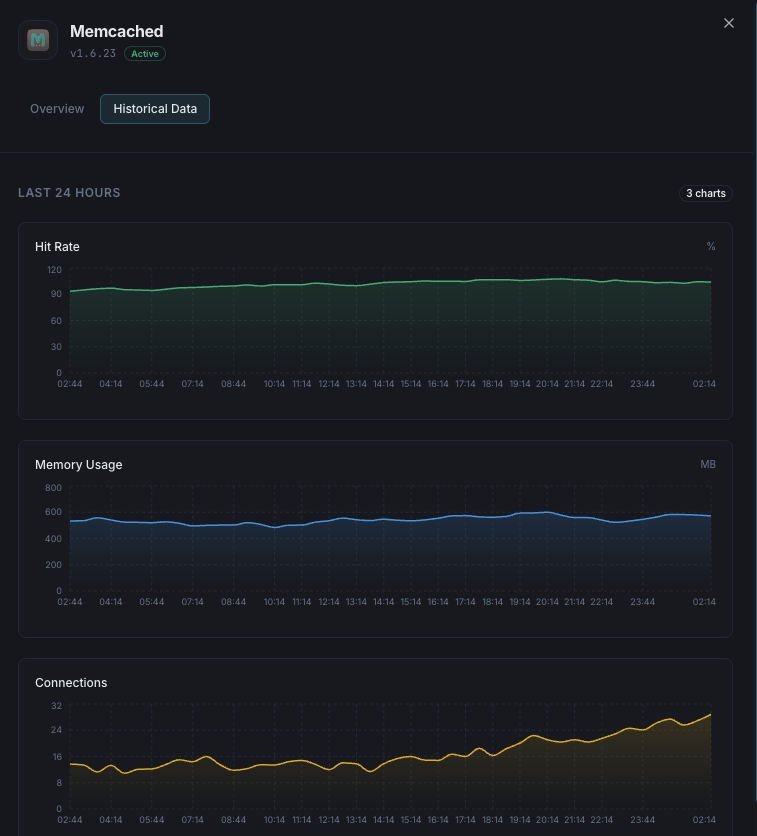
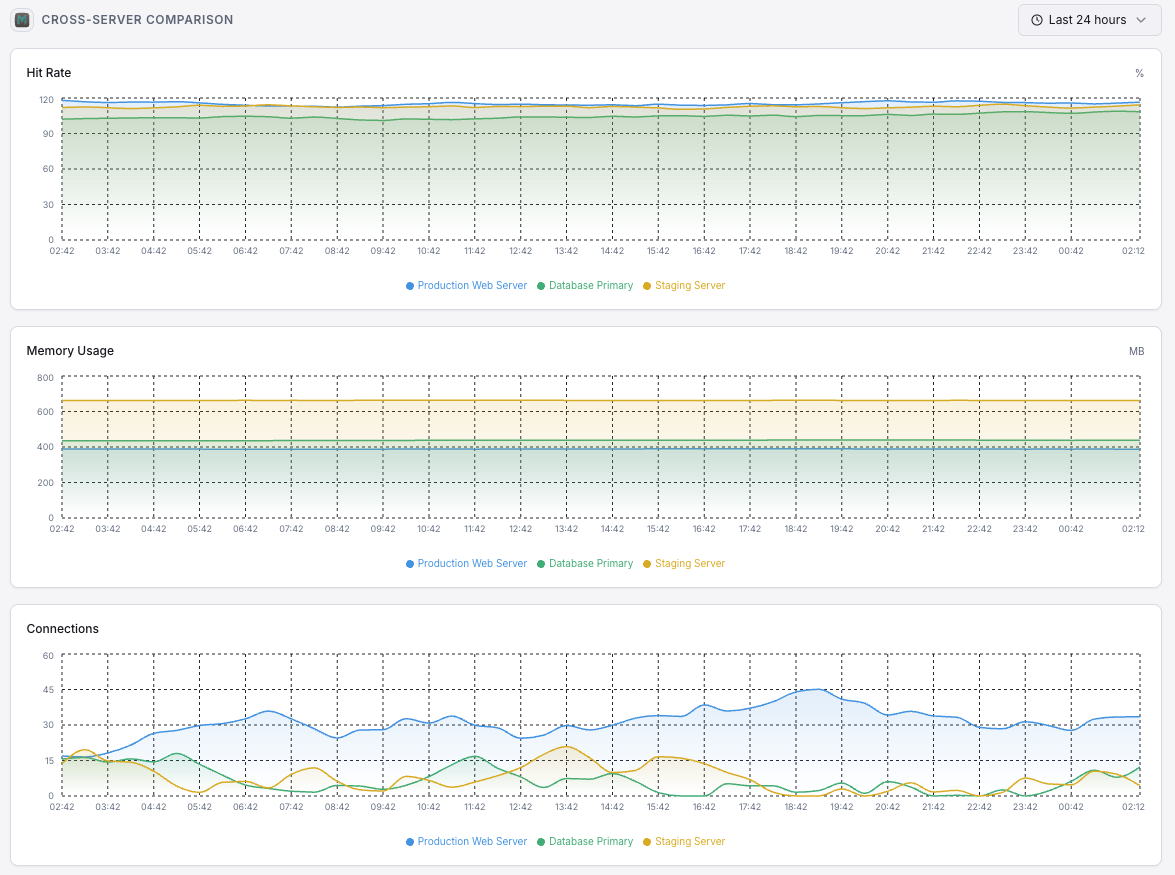
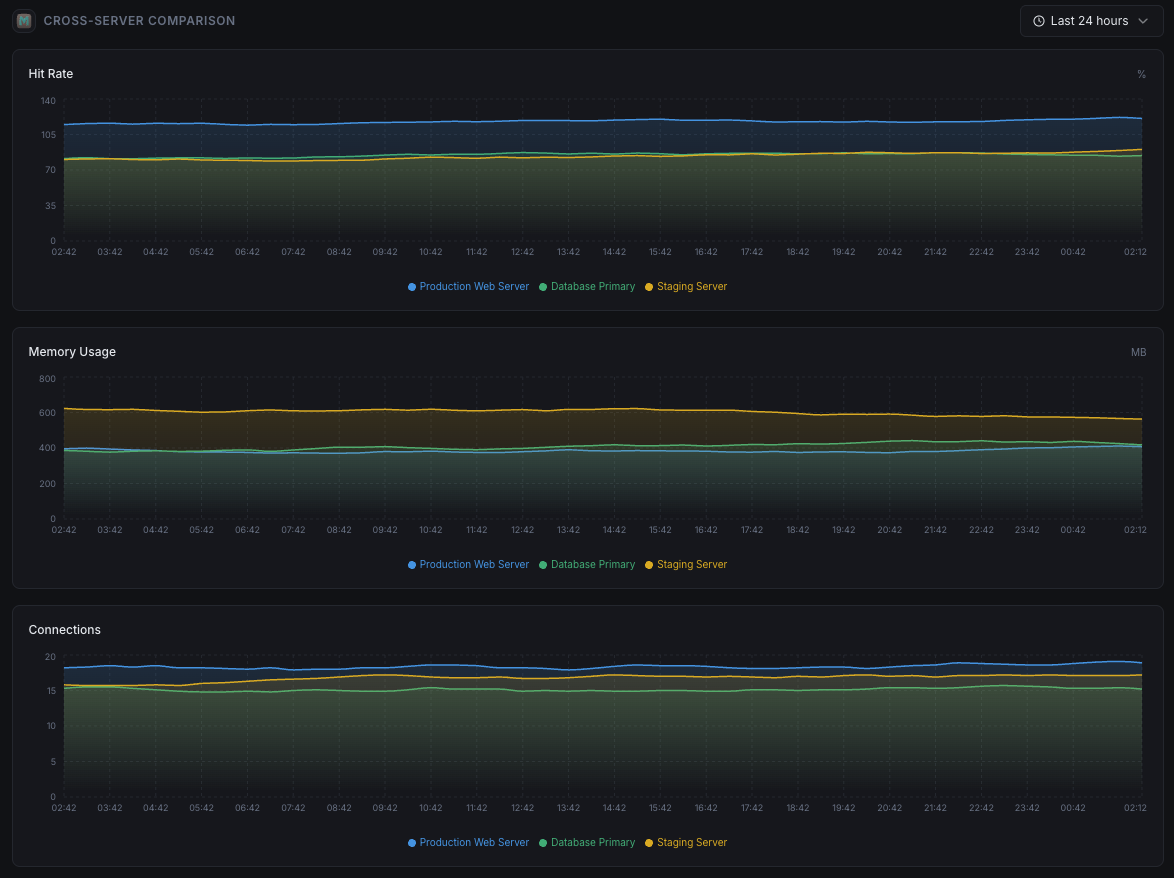
Hit Rate
Percentage of successful cache lookups vs misses, indicating cache effectiveness.
Evictions
Number of items evicted to make room for new data.
Current Connections
Number of currently open client connections.
Items Stored
Total number of items currently stored in cache.
Get/Set Ratio
Ratio of get to set commands, indicating read/write balance.
Bytes Read/Written
Total network throughput for the Memcached instance.
CAS Hits/Misses
Check-and-set operation success rates for concurrent updates.
Slab Utilization
Memory allocation efficiency across slab classes.
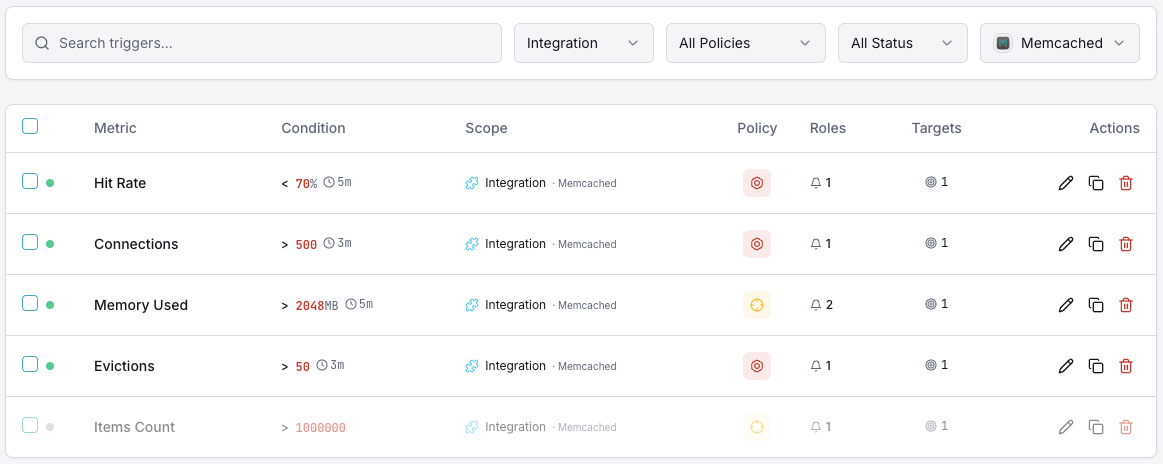
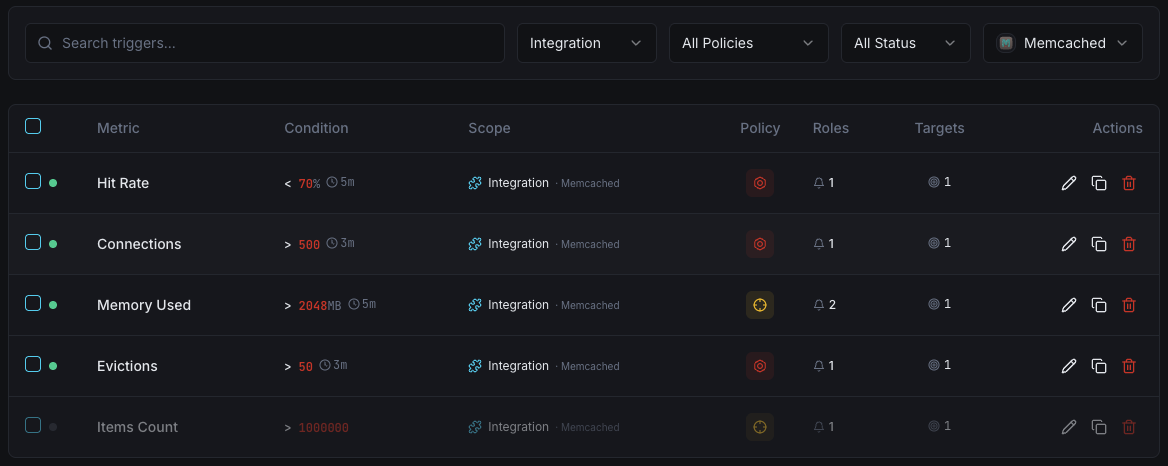
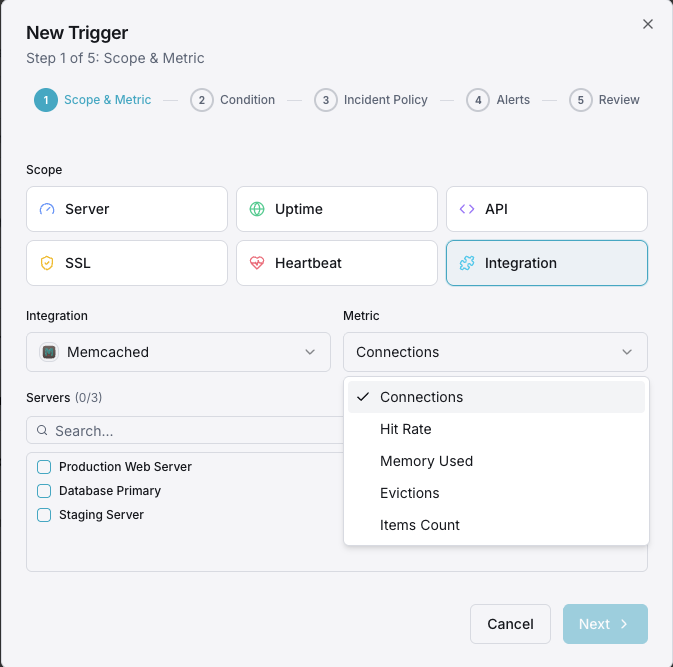
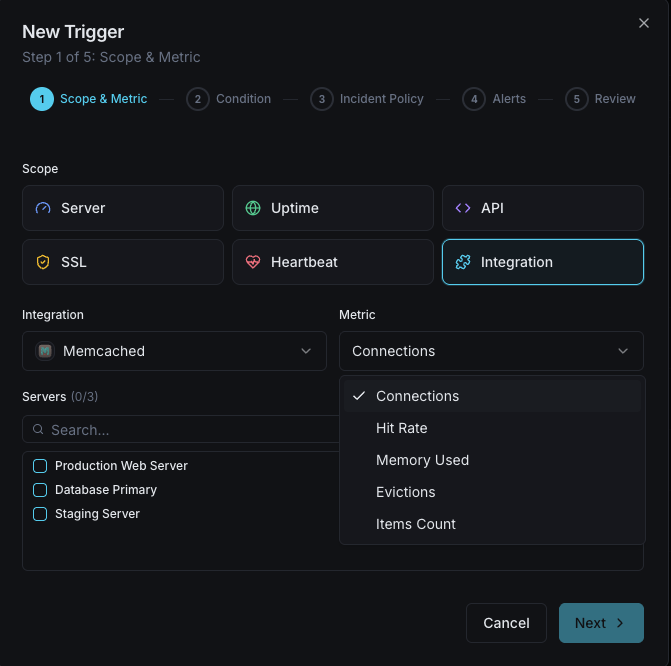
Configurable alert triggers
Set up custom triggers in your dashboard to get notified the moment Memcached metrics cross your defined thresholds.
Memory Usage
criticalFires when Memcached memory consumption approaches the configured limit, risking evictions.
Hit Rate Drop
warningAlerts when cache hit rate drops below threshold, indicating cache inefficiency or working set changes.
Eviction Rate
criticalFires when eviction rate spikes, meaning Memcached is actively removing data to stay within memory limits.
Connection Count
warningTriggers when client connections exceed the threshold, indicating potential connection leaks.
Items Reclaimed
warningAlerts when expired items are being reclaimed at a high rate, suggesting TTL misconfiguration.
Importance of Memcached Monitoring
Memcached silently powers your application's performance layer. Without monitoring, memory exhaustion, eviction storms, and connection leaks can degrade your entire application stack before anyone notices.
- Detect memory pressure before evictions impact application performance
- Monitor cache hit rates to ensure optimal response times
- Track eviction patterns to right-size your memory allocation
- Identify connection leaks from application clients
- Ensure consistent cache performance across distributed nodes
Why Choose Xitoring
Xitoring delivers enterprise-grade Memcached monitoring with zero-config setup. Our lightweight agent auto-discovers your Memcached instances, starts collecting metrics in under 60 seconds, and integrates with your existing notification channels.
- One-command install — no complex YAML or config files
- 50+ global monitoring nodes for low-latency checks
- Unified dashboard for servers, caches, and uptime
- Flexible alerting via Slack, PagerDuty, Telegram & more
- Historical data retention for capacity planning & audits
Get started in minutes
Install Xitogent on your server
If you haven't already, install the lightweight Xitogent monitoring agent on your server.
curl -s https://xitoring.com/install.sh | sudo bashEnsure Memcached stats are accessible
Xitogent uses the Memcached stats command to collect metrics. Verify your instance is reachable locally:
echo 'stats' | nc localhost 11211 | head -10Enable the Memcached integration
Use the Xitoring dashboard or CLI to enable the Memcached integration. Xitogent will auto-detect your instance.
sudo xitogent integrate memcached --enableConfigure alert thresholds (optional)
Set custom thresholds for metrics like memory usage, hit rate, or eviction count to get notified when something needs attention.
Frequently asked questions
Start monitoring Memcached today
Set up in under 60 seconds. No credit card required. Full metrics from day one.
Start Free Trial