MongoDB Monitoring
Monitor MongoDB document operations, replica set health, connections, and storage metrics in real time with zero configuration.
Why monitor MongoDB?
MongoDB is the leading NoSQL document database, powering modern applications with flexible schemas and horizontal scalability. Monitoring MongoDB is critical to track query performance, detect replication lag, manage connection pools, and prevent storage exhaustion. Xitoring's MongoDB integration provides deep visibility into your database cluster health.
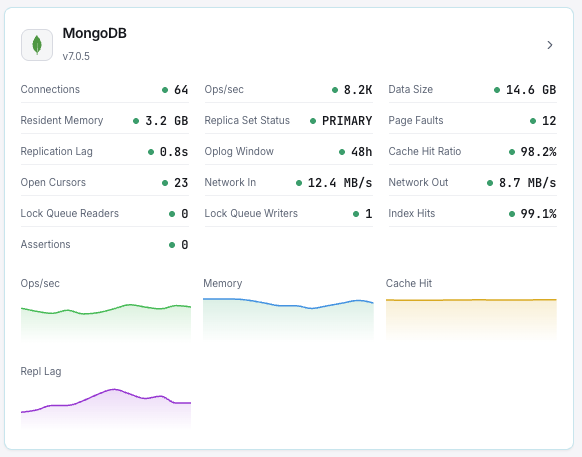
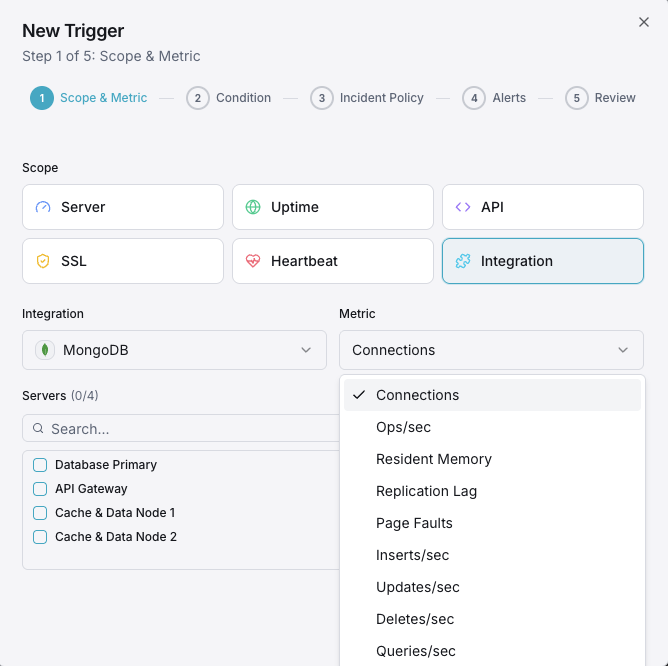
What we monitor
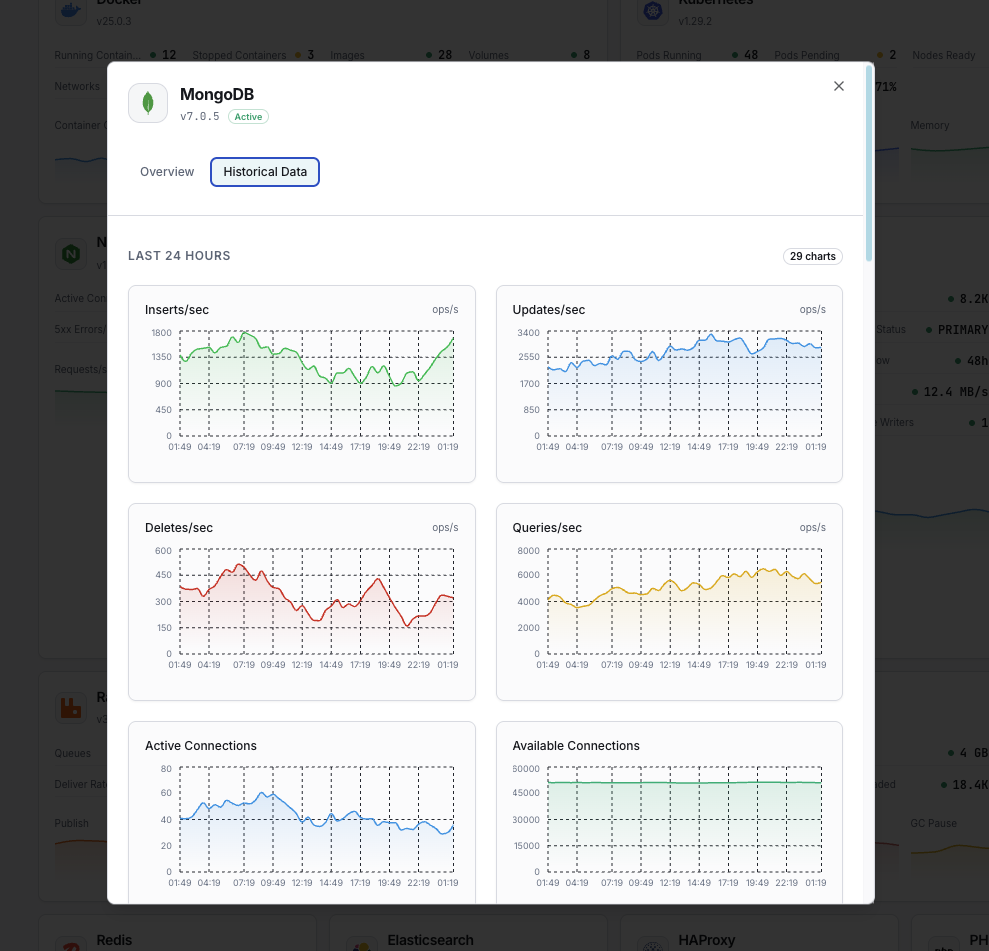
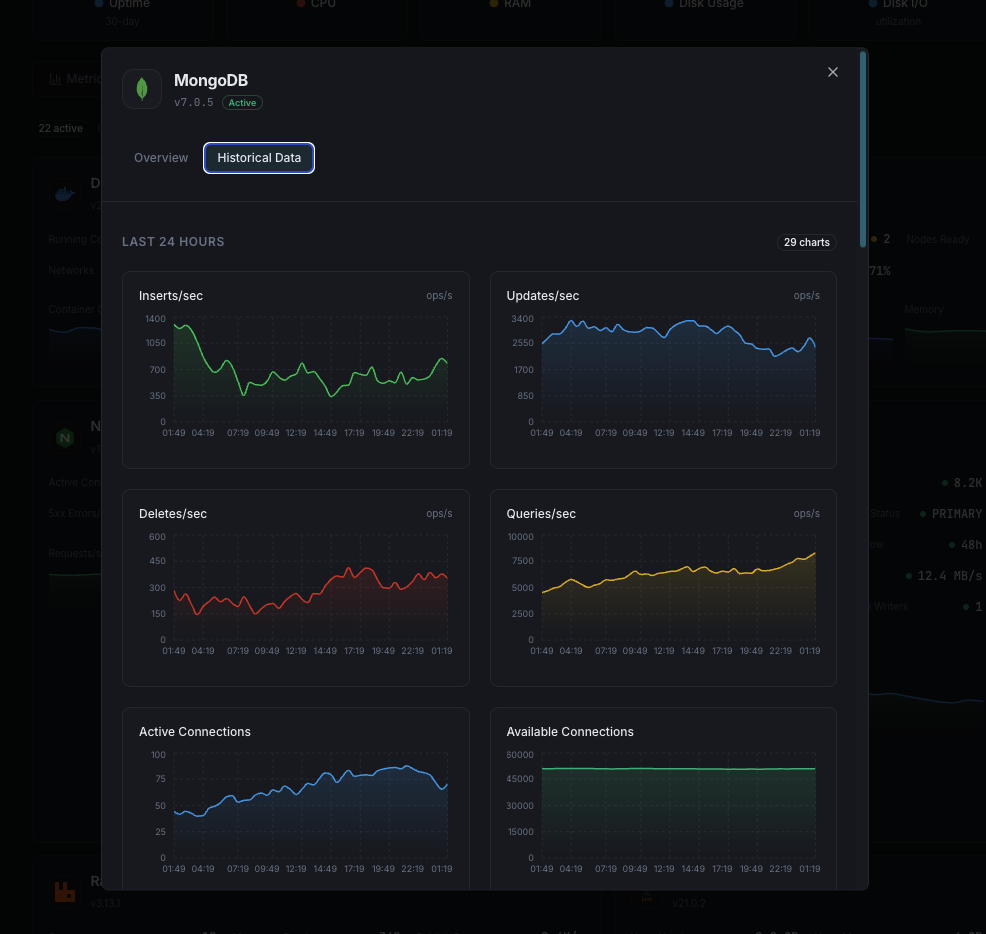
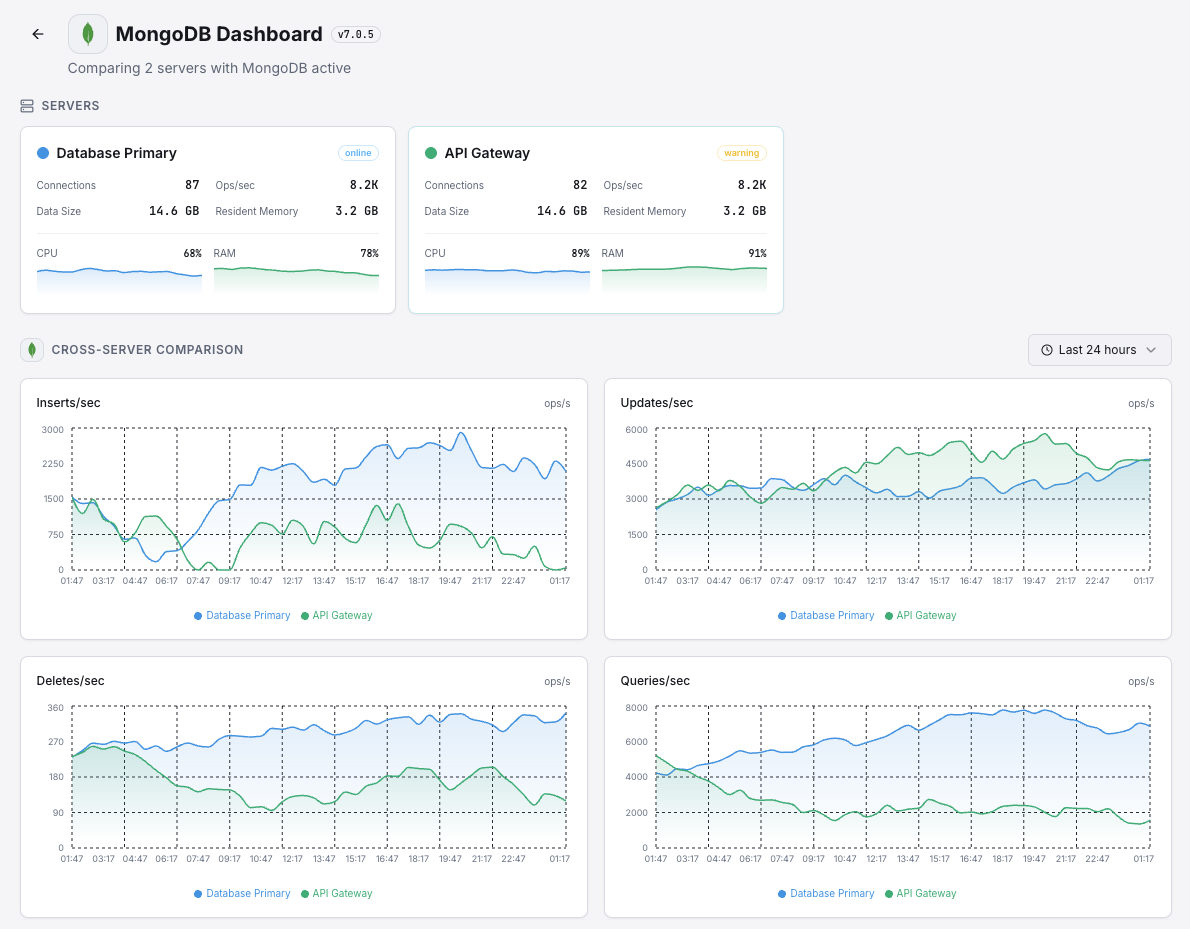
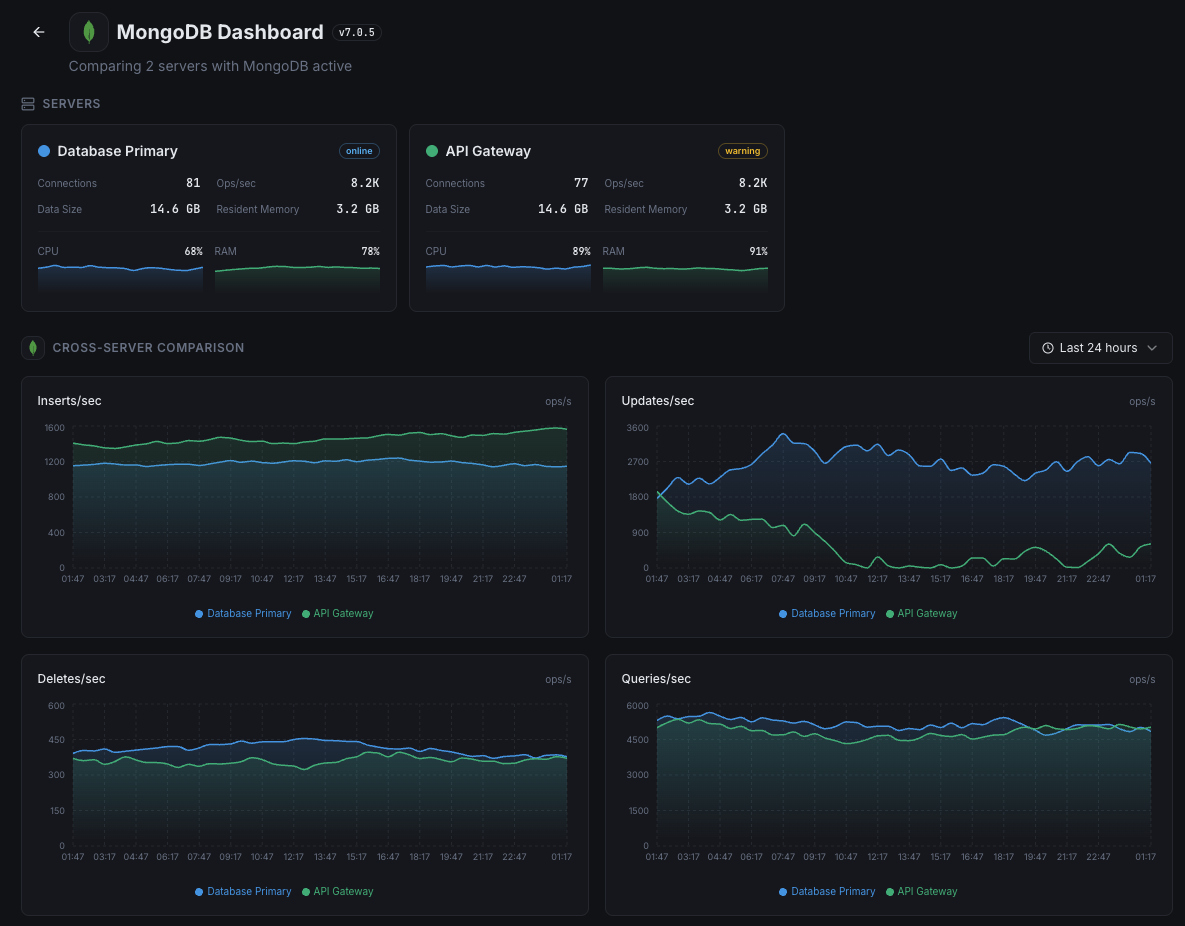
Document Operations
Rate of insert, update, delete, and query operations per second.
Connections
Current active, available, and total connections to the MongoDB instance.
Replication Lag
Time delay between primary and secondary replica set members.
Oplog Window
Duration of operations retained in the oplog for replication.
WiredTiger Cache
Bytes currently in cache, dirty bytes, and cache hit ratio.
Page Faults
Number of page faults indicating data not in memory.
Cursors
Number of open cursors including those with no timeout.
Network I/O
Bytes in/out and number of requests to the MongoDB instance.
Lock Queue
Number of operations waiting to acquire read or write locks.
Index Counters
Index access, hits, and misses indicating index effectiveness.
Storage Size
Total data size, index size, and free space on disk.
Assertions
Count of assert messages including regular, warning, and rollover.
Configurable alert triggers
Set up custom triggers in your dashboard to get notified the moment MongoDB metrics cross your defined thresholds.
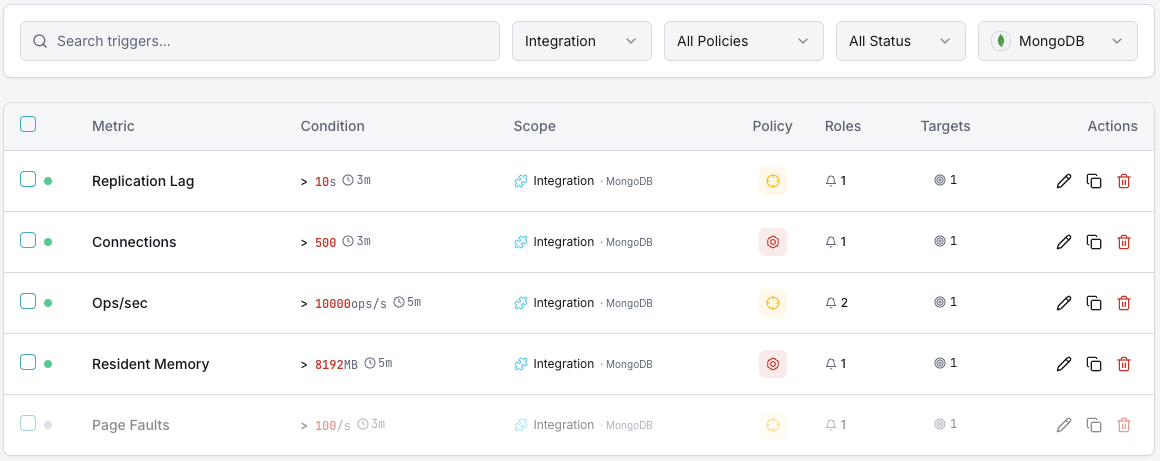
Replication Lag
criticalFires when secondary members fall behind the primary, risking data inconsistency during failover.
Connection Count
warningTriggers when active connections approach the maximum, indicating potential connection pool exhaustion.
WiredTiger Cache Usage
warningAlerts when cache utilization exceeds threshold, leading to increased disk I/O and slower queries.
Page Faults
criticalFires when page fault rate spikes, indicating working set exceeds available memory.
Lock Queue Length
warningTriggers when operations queue for locks, indicating contention and potential performance degradation.
Storage Space
criticalAlerts when disk space usage exceeds threshold, risking database writes being blocked.
Importance of MongoDB Monitoring
MongoDB powers mission-critical applications handling millions of documents. Without monitoring, replication drift, connection exhaustion, and cache pressure can silently degrade performance and lead to data loss.
- Detect replication lag before failover causes data inconsistency
- Monitor document operation rates to identify performance bottlenecks
- Track WiredTiger cache efficiency to optimize memory allocation
- Identify connection pool exhaustion from application clients
- Ensure storage capacity for uninterrupted database operations
Why Choose Xitoring
Xitoring delivers enterprise-grade MongoDB monitoring with zero-config setup. Our lightweight agent auto-discovers your MongoDB instances, starts collecting metrics in under 60 seconds, and integrates with your existing notification channels.
- One-command install — no complex YAML or config files
- 50+ global monitoring nodes for low-latency checks
- Unified dashboard for servers, databases, and uptime
- Flexible alerting via Slack, PagerDuty, Telegram & more
- Historical data retention for capacity planning & audits
Get started in minutes
Install Xitogent on your server
If you haven't already, install the lightweight Xitogent monitoring agent on your server.
curl -s https://xitoring.com/install.sh | sudo bashEnsure MongoDB is accessible
Xitogent uses the MongoDB serverStatus command. Make sure your instance allows local connections:
mongosh --eval "db.serverStatus()" | head -10Enable the MongoDB integration
Use the Xitoring dashboard or CLI to enable the MongoDB integration. Xitogent will auto-detect your MongoDB instance.
sudo xitogent integrate mongodb --enableConfigure alert thresholds (optional)
Set custom thresholds for metrics like replication lag, connection count, or storage usage to get notified when something needs attention.
Frequently asked questions
Start monitoring MongoDB today
Set up in under 60 seconds. No credit card required. Full metrics from day one.
Start Free TrialKeep exploring